
|
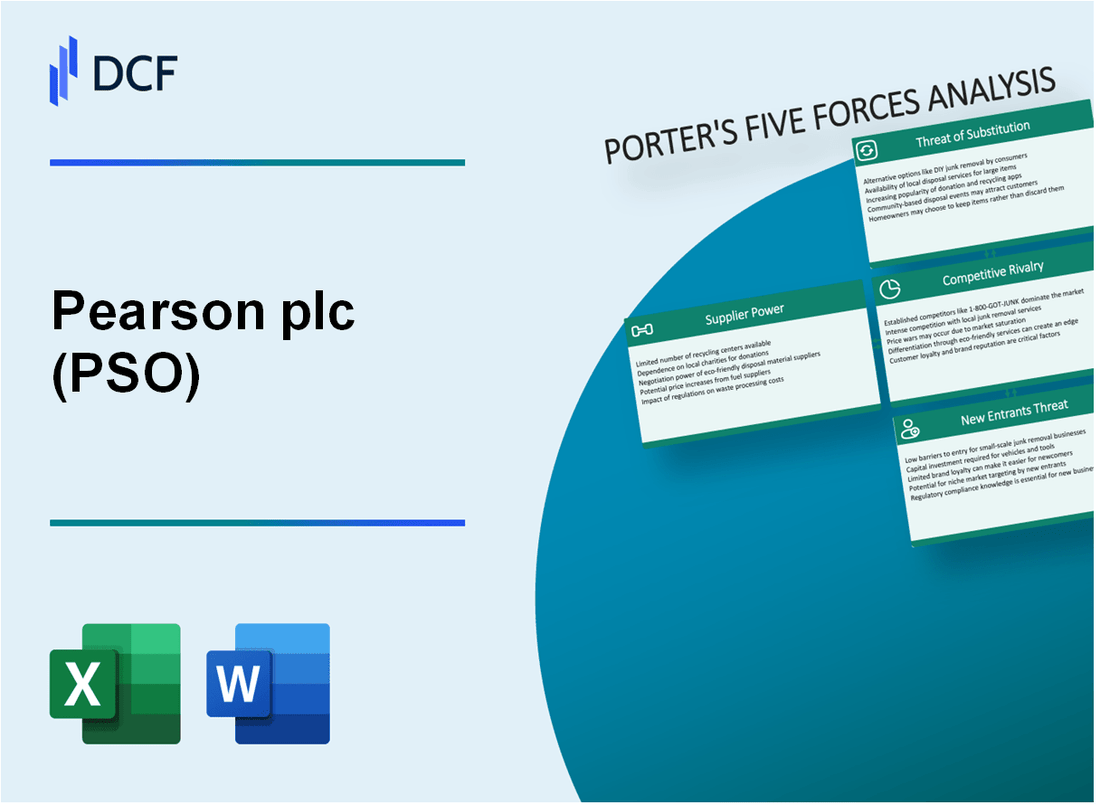
Análisis de 5 Fuerzas de Pearson plc (PSO) [Actualizado en Ene-2025] |
Completamente Editable: Adáptelo A Sus Necesidades En Excel O Sheets
Diseño Profesional: Plantillas Confiables Y Estándares De La Industria
Predeterminadas Para Un Uso Rápido Y Eficiente
Compatible con MAC / PC, completamente desbloqueado
No Se Necesita Experiencia; Fáciles De Seguir
Pearson plc (PSO) Bundle
En el panorama dinámico de la publicación educativa, Pearson PLC (PSO) navega por un complejo ecosistema de fuerzas competitivas que dan forma a sus decisiones estratégicas y posicionamiento del mercado. A medida que la transformación digital revoluciona el aprendizaje, la compañía enfrenta desafíos y oportunidades sin precedentes entre las relaciones con los proveedores, las expectativas de los clientes, las rivalidades tecnológicas, los sustitutos emergentes y los posibles nuevos participantes del mercado. Este análisis exhaustivo de las cinco fuerzas de Porter revela la intrincada dinámica que impulsa la estrategia competitiva de Pearson en 2024, ofreciendo información sobre cómo el gigante de la educación mundial mantiene su relevancia del mercado en medio de rápidos cambios de paradigma tecnológicos y educativos.
Pearson PLC (PSO) - Las cinco fuerzas de Porter: poder de negociación de los proveedores
Número limitado de contenido educativo y proveedores de tecnología
A partir de 2024, Pearson PLC opera en un mercado con aproximadamente 12 principales proveedores de contenido educativo global. Los 5 principales proveedores controlan el 68% del mercado de contenido educativo.
| Categoría de proveedor | Cuota de mercado | Número de proveedores |
|---|---|---|
| Plataformas de aprendizaje digital | 42% | 5 |
| Creadores de contenido académico | 26% | 7 |
Alta dependencia de los creadores de contenido
Pearson se basa en aproximadamente 3.500 investigadores académicos y 2.200 expertos en la materia a nivel mundial para el desarrollo de contenido.
- Valor promedio del contrato con los principales investigadores académicos: $ 87,500 anualmente
- Número de asociaciones exclusivas de creación de contenido: 124
- Porcentaje de contenido de creadores externos: 62%
Inversión en materiales educativos
Pearson invirtió $ 412 millones en Infraestructura de Desarrollo de Contenido y Tecnología en 2023.
| Área de inversión | Gasto |
|---|---|
| Desarrollo de contenido digital | $ 243 millones |
| Infraestructura tecnológica | $ 169 millones |
Negociaciones de derechos de propiedad intelectual
En 2023, Pearson administró 486 negociaciones de propiedad intelectual activa con creadores de contenido.
- Costo promedio de licencias de IP: $ 45,300 por contrato
- Gasto total de derechos de IP: $ 22.1 millones
- Tasa de éxito de la negociación: 87%
Pearson PLC (PSO) - Las cinco fuerzas de Porter: poder de negociación de los clientes
Power de negociación de los compradores institucionales grandes
El segmento del mercado educativo de Pearson revela un poder significativo de negociación de clientes a través de la compra institucional:
| Segmento del comprador | Volumen de compras anual | Apalancamiento |
|---|---|---|
| Distritos escolares K-12 | $ 4.2 mil millones | Alto |
| Instituciones de educación superior | $ 3.7 mil millones | Muy alto |
| Capacitación corporativa | $ 1.5 mil millones | Medio |
Sensibilidad a los precios en el mercado educativo
Indicadores de sensibilidad de precios:
- Elasticidad promedio del precio: 2.3
- Demandas de reducción de costos: 15-20% anual
- Presión de restricción presupuestaria: 78% de los compradores institucionales
Demanda de soluciones de aprendizaje digital
Métricas de crecimiento del mercado de aprendizaje digital:
| Segmento de mercado | 2024 Ingresos proyectados | Índice de crecimiento |
|---|---|---|
| Plataformas de aprendizaje en línea | $ 325 mil millones | 17.5% |
| Tecnología de aprendizaje adaptativo | $ 5.2 mil millones | 22.3% |
Dinámica competitiva del mercado
Indicadores de paisaje competitivos:
- Número de proveedores de contenido educativo: 127
- Ratio de concentración del mercado: 42%
- Costo de cambio de cliente: bajo a medio
Pearson PLC (PSO) - Cinco fuerzas de Porter: rivalidad competitiva
Panorama competitivo del mercado
A partir de 2024, Pearson PLC enfrenta una intensa competencia en el mercado editorial educativo con los siguientes competidores clave:
| Competidor | Cuota de mercado | Ingresos anuales |
|---|---|---|
| Educación McGraw-Hill | 18.5% | $ 1.7 mil millones |
| Aprendizaje de cengage | 15.3% | $ 1.4 mil millones |
| Pearson PLC | 22.7% | $ 4.2 mil millones |
Factores de intensidad competitivos
La rivalidad competitiva se caracteriza por los siguientes elementos clave:
- Competencia de plataforma de aprendizaje digital: 67% de editores educativos que invierten en tecnologías de aprendizaje en línea
- Tasa de consolidación del mercado: 3-4 fusiones estratégicas por año en sector editorial educativo
- Inversión de I + D: 12-15% de los ingresos anuales asignados a la innovación tecnológica
Métricas de tecnología e innovación
| Métrica de innovación | Valor 2024 |
|---|---|
| Usuarios de plataforma de aprendizaje digital | 42 millones |
| Contenido educativo mejorado con AI | 28% de penetración del mercado |
| Desarrollo del curso en línea | $ 680 millones de inversión |
Dinámica del mercado
Espectáculos de paisajes competitivos:
- Fragmentación del mercado: Los 4 editores principales controlan el 62% del mercado de contenido educativo
- Mercado de tecnología educativa global: Proyectado para llegar a $ 404 mil millones para 2025
- Tasa de adopción de contenido digital: 53% de las instituciones educativas que hacen la transición a plataformas digitales
Pearson PLC (PSO) - Las cinco fuerzas de Porter: amenaza de sustitutos
Competencia de plataformas de aprendizaje en línea
Coursera reportó 77 millones de usuarios registrados a partir de 2023. EDX tiene 35 millones de alumnos a nivel mundial. Udemy llegó a 62 millones de estudiantes en todo el mundo en 2023.
| Plataforma | Usuarios registrados (2023) | Ingresos anuales |
|---|---|---|
| Cursera | 77 millones | $ 579.7 millones |
| edx | 35 millones | $ 171 millones |
| Udemy | 62 millones | $ 518 millones |
Impacto de recursos educativos de código abierto
OpenStax produjo 64 libros de texto digitales gratuitos con 2.2 millones de usuarios anuales. MIT OpenCourseware ofrece 2.500 cursos a los que acceden 225 millones de usuarios desde 2002.
- Libros de texto OpenStax descargados 12.5 millones de veces en 2022
- Khan Academy atiende a 18 millones de usuarios activos mensuales
- La educación de Wikipedia llega a 52 millones de estudiantes anualmente
Disponibilidad de contenido digital
Los canales educativos de YouTube acumularon 1.300 millones de visitas a los videos educativos mensualmente. Los podcasts relacionados con la educación crecieron un 42% en la base de oyentes durante 2022.
| Plataforma digital | Alcance de contenido educativo mensual |
|---|---|
| Educación de YouTube | 1.300 millones de visitas |
| Podcasts educativos | Crecimiento del 42% en 2022 |
Mercado de aprendizaje personalizado
Global Personalized Learning Market proyectado para llegar a $ 2.1 mil millones para 2024 con una tasa de crecimiento anual del 35%.
- Las plataformas de aprendizaje personalizadas impulsadas por la IA aumentaron un 67% en la adopción del usuario
- Mercado de tecnología de aprendizaje adaptativo valorado en $ 1.4 mil millones en 2023
Pearson PLC (PSO) - Las cinco fuerzas de Porter: amenaza de nuevos participantes
Requisitos de capital en el desarrollo de contenido educativo
El desarrollo de contenido educativo de Pearson requiere una inversión financiera significativa. En 2023, Pearson invirtió $ 654 millones en investigación y desarrollo, creando barreras sustanciales para los posibles participantes del mercado.
| Categoría de inversión | Cantidad (2023) |
|---|---|
| Gasto de I + D | $ 654 millones |
| Costos de desarrollo de contenido | $ 412 millones |
| Infraestructura tecnológica | $ 243 millones |
Reputación de marca y barreras de entrada al mercado
La posición del mercado de Pearson demuestra barreras de entrada significativas:
- Cuota de mercado educativo global: 37.2%
- Presencia establecida en 180 países
- Más de 40 años de experiencia en publicación educativa continua
Complejidad regulatoria
La publicación educativa involucra entornos regulatorios complejos en múltiples jurisdicciones.
| Áreas de cumplimiento regulatoria | Nivel de complejidad |
|---|---|
| Estándares de educación internacional | Alto |
| Licencias de contenido digital | Medio-alto |
| Regulaciones de privacidad de datos | Alto |
Requisitos de red de distribución
Las redes de infraestructura y distribución tecnológica representan barreras de entrada críticas:
- REECHA DE LA PLATAFORMA DIGITAL: 22 millones de usuarios activos
- Inversiones de plataforma de aprendizaje en línea: $ 286 millones en 2023
- Canales de distribución global: más de 150 países
Pearson plc (PSO) - Porter's Five Forces: Competitive rivalry
You're assessing the competitive landscape for Pearson plc right now, late in 2025, and honestly, the rivalry is fierce. The global education market Pearson operates in is anything but consolidated; it's fragmented, and that fragmentation fuels constant pressure on pricing and innovation.
The sheer number of players is staggering. Pearson is ranked 15th among its 231 active competitors in the space. That means there are over 230 other entities actively vying for the same customer spend, whether it's a school district, a university, or a professional looking to upskill. That level of competition definitely keeps management busy.
Competition isn't just coming from the established giants. Direct competitors are a mix of traditional publishing houses and nimble digital-first operations. While you see names like Cambridge University Press in the traditional sphere, the digital front is where things are heating up fast. We see companies like Stride, Inc. profiled in market analyses alongside Pearson in key segments like K-12. The battleground has decisively shifted to technology.
Competition is intensifying around AI-enhanced learning tools and digital platform features. Pearson is clearly trying to stay ahead, evidenced by its strategic cloud partnerships with Microsoft, AWS, and most recently, Google Cloud. They are embedding this tech, rolling out features like the "Go Deeper" AI-powered study tool and the AI GCSE Exam Practice Assistant. It's a race to see whose platform can deliver the most personalized, effective, and scalable digital experience.
To gauge the effect of this rivalry, look at the top-line results. Pearson's underlying sales growth for the first half of 2025 came in at 2%. Modest, right? That low single-digit number tells you that while the underlying business is moving forward, it's a tough slog for market share gains against so many rivals. It suggests aggressive price competition or slow adoption curves in certain areas, masking the growth in high-performing units like Higher Education, which saw 4% underlying growth in H1 2025. Here's the quick math on that H1 performance:
| Financial Metric (H1 2025) | Amount | Context/Comparison |
| Underlying Sales Growth | 2% | Modest growth indicating market share battles. |
| Total Sales | £1,722 million | Headline sales figure for the six months ended June 30, 2025. |
| Adjusted Operating Profit | £242 million | Up 2% on an underlying basis. |
| Free Cash Flow | £156 million | Surged by £129 million year-on-year. |
Still, Pearson isn't without its structural advantages, which act as a partial defense against aggressive rivals. These are the high exit barriers that keep the playing field somewhat stable, even if the day-to-day competition is brutal. You can't just spin up a global testing operation overnight.
These barriers are built on scale and intellectual property:
- Vast network of testing centers through Pearson VUE.
- High-quality, research-backed Clinical Assessment products.
- Globally recognized UK-curriculum-based qualifications (GCSEs, A levels).
- Extensive, proprietary digital learning platforms and content libraries.
The company's ability to deliver scaled testing services globally and its deep portfolio of established qualifications-recognized across 90 countries-create significant switching costs for institutional buyers. Finance: draft 13-week cash view by Friday.
Pearson plc (PSO) - Porter's Five Forces: Threat of substitutes
You're looking at the competitive landscape for Pearson plc, and the substitutes are not just knocking; they're already inside the building, especially where content creation and delivery are concerned. The threat here is substantial because the cost of switching from a Pearson textbook or digital courseware to an alternative is often near zero for the end-user.
Free and low-cost Massive Open Online Courses (MOOCs) and open-source content
Massive Open Online Courses (MOOCs) represent a direct, scalable alternative to traditional courseware. The global MOOC market size was valued at USD 26 billion in 2024 and is estimated to grow at a 39.3% CAGR from 2025 to 2034, reaching a projected USD 684.3 billion by 2034. For the year 2025, the market size is estimated at USD 25.39 billion. This growth is fueled by the demand for affordable education and the freemium model, which held 38.74% of the market share in 2024. To put this into perspective on adoption, as per a report published by Harvard Online in May 2024, 60% of all undergraduates enrolled in at least one online course. Furthermore, about 45% of large corporations now use MOOCs for employee training and development. Open-source content, while harder to quantify financially as a direct substitute, erodes the perceived value of proprietary content, especially in foundational subjects.
Generative AI tools like ChatGPT
Generative AI tools are rapidly threatening Pearson's core content creation model by offering instant, personalized study aids and lesson plans. The Generative AI in EdTech market size is projected to grow from $0.36 billion in 2024 to $0.53 billion in 2025, with a compound annual growth rate (CAGR) of 44.1%. The broader AI in Education Market is estimated at USD 6.90 billion in 2025. The adoption rate among users is staggering: 86% of students globally are using AI tools for their studies in 2025, and 88% of students have used generative AI for assessments, up from 53% in 2024. Honestly, when 58% of all university instructors use generative AI in their daily practice, it signals a fundamental shift in how content is consumed and created.
Here's a quick look at how the growth of these substitutes compares to Pearson's recent performance:
| Metric | Substitute Market Data Point | Pearson plc Data Point (H1 2025) |
|---|---|---|
| Market Growth Rate (CAGR) | MOOC Market: 39.3% (2025-2034) | Group Underlying Sales Growth: 2% (H1 2025) |
| Market Size (Base Year) | AI in Education Market: USD 6.90 billion (2025) | Group Sales: £1,722m (H1 2025) |
| High Growth Segment | Generative AI in EdTech: 44.1% CAGR (2024-2025) | Enterprise Learning & Skills Sales Growth (Guidance): High single digits (2025) |
Corporate in-house training programs
Pearson's Enterprise Learning & Skills segment faces substitution from companies building capabilities internally. While Pearson is seeing momentum, with its Enterprise Solutions expecting solid growth, the trend of internal development is a persistent threat. As noted, about 45% of large corporations use MOOCs for employee training, which is a form of outsourcing, but the alternative is building proprietary, in-house programs that bypass external providers entirely. The fact that the Corporate Training and Skill Development segment within the AI in Education market posts the fastest growth at a 44.80% CAGR suggests significant investment is flowing into these internal or dedicated corporate learning solutions, pulling spend away from generalist providers.
Certification and assessment substitutes
The assessment and certification space, where Pearson VUE operates, is seeing competition from vendor-specific and non-traditional credentials. Pearson VUE sales declined 3% on an underlying basis in H1 2025, driven partly by a contract pause and headwinds in PDRI due to US federal government spend reductions. This contrasts with the Clinical Assessment business, which grew, and the overall Assessment & Qualifications sales, which were up 2% underlying in H1 2025. The rise of stackable blockchain badges, which 95% of employers perceive as at least equal to traditional transcripts in some US pilots, directly challenges the value proposition of established certification bodies. Furthermore, the certificate & professional courses market within MOOCs is anticipated to grow at a 41.8% CAGR, indicating strong demand for focused, alternative credentials.
- Clinical Assessment sales showed growth in H1 2025.
- Pearson VUE sales declined 3% on an underlying basis in H1 2025.
- The professional courses segment of MOOCs is projected to grow at a 41.8% CAGR.
- The company is pursuing strategic collaborations, such as one with McGraw Hill in formative assessments.
Pearson plc (PSO) - Porter's Five Forces: Threat of new entrants
The threat of new entrants for Pearson plc is best characterized as moderate. While the digital nature of education technology allows for niche disruption, the core, high-stakes assessment and large-scale contract businesses remain protected by significant structural barriers.
The requirement to build and maintain a global testing network, particularly for Pearson VUE, and to secure large government assessment contracts demands substantial upfront capital and operational scale. Consider the sheer operational footprint Pearson plc manages: they secured a four-year contract from the UK Department for Education to manage national curriculum assessment tests starting in the 2025/26 academic year, servicing over 16,500+ primary schools across England. Building the logistics, scanning, and data delivery infrastructure for that volume represents a high barrier to entry. Furthermore, headwinds in the PDRI segment of Pearson VUE were explicitly linked to US federal government hiring and spend reductions in H1 2025, showing the dependency on, and the high barrier of entry into, these government procurement cycles.
Digital-first startups can certainly enter specific, less regulated niches with comparatively lower capital outlay. For instance, a company like CourseKey, which focuses on school management solutions including digital assessments, has raised a total of $20 million over 6 funding rounds as of late 2025, with its latest funding activity in January 2025. While this demonstrates venture capital interest in EdTech, the $20 million figure is dwarfed by the capital Pearson deploys strategically, such as the $225 million cash consideration paid for the acquisition of eDynamic Learning in 2025. These startups, while agile, still lack the established brand recognition and the deep accreditation required to challenge Pearson's market share in high-stakes testing, where brand trust is paramount.
Regulatory barriers in the K-12 and professional assessment spaces create a strong moat. In K-12, while there are no federal accreditation requirements, schools must meet specific state standards for performance. To gain the legitimacy needed for widespread adoption, especially for college admissions or state scholarship eligibility, regional accreditation is often necessary. This process requires adherence to external quality standards across governance, faculty qualifications, and student outcomes, demanding time and investment to align frameworks. For a new entrant, navigating this patchwork of state-level requirements is a major hurdle, especially when incumbents like Pearson plc have decades of established relationships and compliance history. The overall K-12 Testing and Assessment Market size was valued at $11.17 billion in 2025, indicating the value protected by these regulatory and trust barriers.
Pearson plc actively uses its financial strength to preemptively block entry into adjacent, growing segments. The acquisition of eDynamic Learning in H2 2025 is a clear example of this strategy. eDynamic Learning, which serves over 885,000 K-12 students and offers 325 digital courses across 40+ career pathways, was bought specifically to scale Pearson's position in the fast-growing Early Careers space. By spending $225 million to integrate a leader in Career and Technical Education, Pearson effectively acquires the necessary IP, customer base, and market momentum, raising the entry cost for any other startup aiming for that segment.
Here's a quick view of the scale of Pearson's established positions versus a digital challenger:
| Metric | Pearson plc (Scale/Investment) | CourseKey (Challenger Example) |
|---|---|---|
| H1 2025 Group Sales | £1,722 million | Not Publicly Disclosed (SaaS/Niche) |
| eDynamic Learning Acquisition Cost (2025) | $225 million | Total Funding Raised: $20 million |
| UK Govt. Assessment Contract Scope | Servicing 16,500+ primary schools | Serves over 9,000 K-12 schools/institutions (eDynamic) |
| Reported Digital Reach (eDynamic) | Serving over 885,000 K-12 students | Reported ~100,000 paying users (2019) |
The investment in strategic acquisitions, like the $225 million deal, demonstrates that Pearson is willing to pay a premium, at 13x adjusted EBITDA, to secure market share rather than allowing a new entrant to build it organically.
Disclaimer
All information, articles, and product details provided on this website are for general informational and educational purposes only. We do not claim any ownership over, nor do we intend to infringe upon, any trademarks, copyrights, logos, brand names, or other intellectual property mentioned or depicted on this site. Such intellectual property remains the property of its respective owners, and any references here are made solely for identification or informational purposes, without implying any affiliation, endorsement, or partnership.
We make no representations or warranties, express or implied, regarding the accuracy, completeness, or suitability of any content or products presented. Nothing on this website should be construed as legal, tax, investment, financial, medical, or other professional advice. In addition, no part of this site—including articles or product references—constitutes a solicitation, recommendation, endorsement, advertisement, or offer to buy or sell any securities, franchises, or other financial instruments, particularly in jurisdictions where such activity would be unlawful.
All content is of a general nature and may not address the specific circumstances of any individual or entity. It is not a substitute for professional advice or services. Any actions you take based on the information provided here are strictly at your own risk. You accept full responsibility for any decisions or outcomes arising from your use of this website and agree to release us from any liability in connection with your use of, or reliance upon, the content or products found herein.