
|
AT&T Inc. (T) Évaluation DCF |
Entièrement Modifiable: Adapté À Vos Besoins Dans Excel Ou Sheets
Conception Professionnelle: Modèles Fiables Et Conformes Aux Normes Du Secteur
Pré-Construits Pour Une Utilisation Rapide Et Efficace
Compatible MAC/PC, entièrement débloqué
Aucune Expertise N'Est Requise; Facile À Suivre
AT&T Inc. (T) Bundle
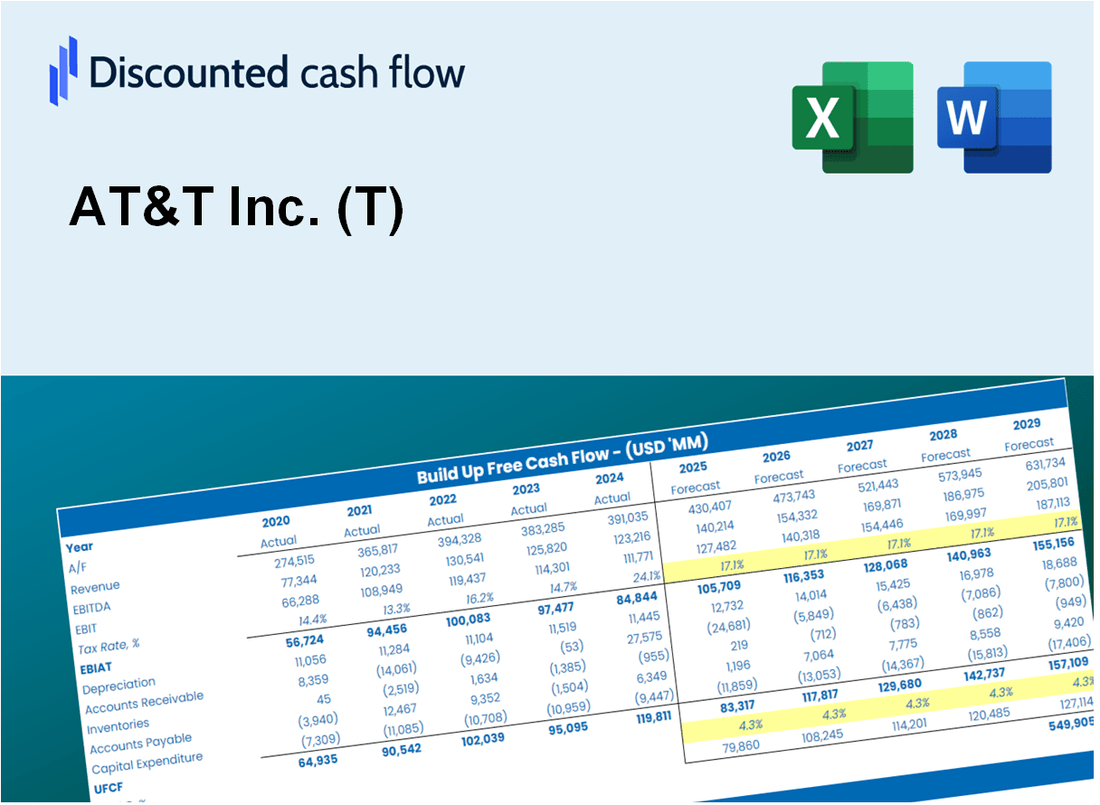
Gagnez du temps et améliorez la précision avec notre (T) calculatrice DCF! En utilisant des données AT&T réelles et des hypothèses personnalisables, cet outil vous permet de prévoir, d'analyser et de valoriser AT&T Inc. comme un investisseur chevronné.
What You Will Get
- Real AT&T Data: Preloaded financials – from revenue to EBIT – based on actual and projected figures.
- Full Customization: Adjust all critical parameters (yellow cells) like WACC, growth %, and tax rates.
- Instant Valuation Updates: Automatic recalculations to analyze the impact of changes on AT&T’s fair value.
- Versatile Excel Template: Tailored for quick edits, scenario testing, and detailed projections.
- Time-Saving and Accurate: Skip building models from scratch while maintaining precision and flexibility.
Key Features
- Comprehensive DCF Calculator: Offers detailed unlevered and levered DCF valuation models tailored for AT&T Inc. (T).
- WACC Calculator: Features a pre-built Weighted Average Cost of Capital sheet with adjustable inputs specific to AT&T Inc. (T).
- Customizable Forecast Assumptions: Easily modify growth rates, capital expenditures, and discount rates for accurate projections.
- Integrated Financial Ratios: Evaluate profitability, leverage, and efficiency ratios pertinent to AT&T Inc. (T).
- Interactive Dashboard and Charts: Visual representations provide a summary of key valuation metrics for straightforward analysis.
How It Works
- 1. Access the Template: Download and open the Excel file containing AT&T Inc.'s (T) financial data.
- 2. Adjust Assumptions: Modify key variables such as growth projections, WACC, and capital expenditures.
- 3. Analyze Results Immediately: The DCF model automatically computes intrinsic value and NPV.
- 4. Explore Scenarios: Evaluate various forecasts to understand different valuation possibilities.
- 5. Present with Assurance: Showcase expert valuation analyses to back your strategic decisions.
Why Choose AT&T Inc. (T) Stock Calculator?
- Save Time: Instantly access a comprehensive DCF model without the hassle of building one from the ground up.
- Enhance Accuracy: Utilize dependable financial data and formulas to minimize valuation errors.
- Fully Customizable: Adjust the model to align with your specific assumptions and forecasts.
- Easy to Understand: Intuitive charts and outputs simplify the analysis of results.
- Endorsed by Professionals: Crafted for experts who prioritize accuracy and ease of use.
Who Should Use This Product?
- Investors: Accurately estimate AT&T Inc.'s (T) fair value before making investment decisions.
- CFOs: Leverage a professional-grade DCF model for financial reporting and analysis related to AT&T Inc. (T).
- Consultants: Quickly adapt the template for valuation reports for AT&T Inc. (T) clients.
- Entrepreneurs: Gain insights into financial modeling used by major telecommunications companies like AT&T Inc. (T).
- Educators: Use it as a teaching tool to demonstrate valuation methodologies relevant to AT&T Inc. (T).
What the Template Contains
- Pre-Filled DCF Model: AT&T Inc.’s (T) financial data preloaded for immediate use.
- WACC Calculator: Detailed calculations for Weighted Average Cost of Capital.
- Financial Ratios: Evaluate AT&T Inc.’s (T) profitability, leverage, and efficiency.
- Editable Inputs: Change assumptions such as growth, margins, and CAPEX to fit your scenarios.
- Financial Statements: Annual and quarterly reports to support detailed analysis.
- Interactive Dashboard: Easily visualize key valuation metrics and results.
Disclaimer
All information, articles, and product details provided on this website are for general informational and educational purposes only. We do not claim any ownership over, nor do we intend to infringe upon, any trademarks, copyrights, logos, brand names, or other intellectual property mentioned or depicted on this site. Such intellectual property remains the property of its respective owners, and any references here are made solely for identification or informational purposes, without implying any affiliation, endorsement, or partnership.
We make no representations or warranties, express or implied, regarding the accuracy, completeness, or suitability of any content or products presented. Nothing on this website should be construed as legal, tax, investment, financial, medical, or other professional advice. In addition, no part of this site—including articles or product references—constitutes a solicitation, recommendation, endorsement, advertisement, or offer to buy or sell any securities, franchises, or other financial instruments, particularly in jurisdictions where such activity would be unlawful.
All content is of a general nature and may not address the specific circumstances of any individual or entity. It is not a substitute for professional advice or services. Any actions you take based on the information provided here are strictly at your own risk. You accept full responsibility for any decisions or outcomes arising from your use of this website and agree to release us from any liability in connection with your use of, or reliance upon, the content or products found herein.