
|
Toast, Inc. (TOST): ANSOFF Matrix Analysis [Jan-2025 Mise à jour] |
Entièrement Modifiable: Adapté À Vos Besoins Dans Excel Ou Sheets
Conception Professionnelle: Modèles Fiables Et Conformes Aux Normes Du Secteur
Pré-Construits Pour Une Utilisation Rapide Et Efficace
Compatible MAC/PC, entièrement débloqué
Aucune Expertise N'Est Requise; Facile À Suivre
Toast, Inc. (TOST) Bundle
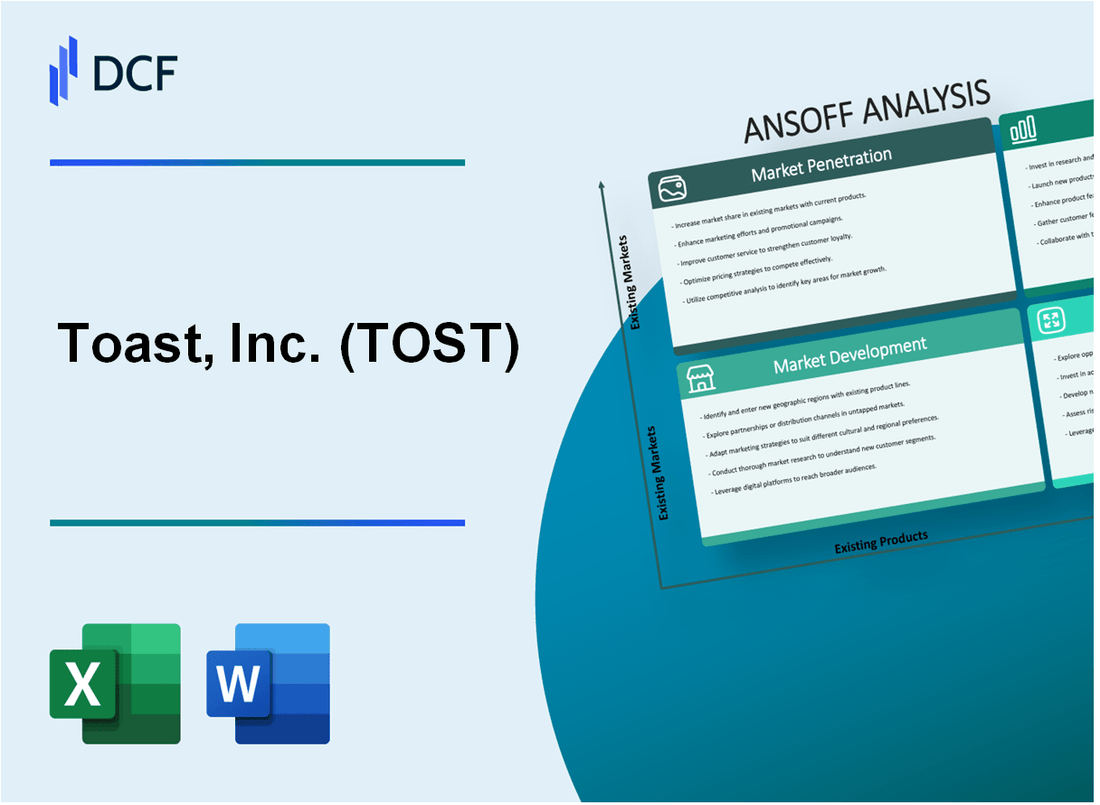
Dans le paysage rapide de la technologie des restaurants en évolution, Toast, Inc. (TOST) se positionne stratégiquement pour une croissance transformatrice à travers plusieurs dimensions. En fabriquant méticuleusement une matrice ANSOff complète, la société dévoile une feuille de route ambitieuse qui couvre la pénétration du marché, le développement, l'innovation des produits et la diversification stratégique. De l'amélioration des capacités de plate-forme existantes à l'exploration des technologies de pointe comme les analyses alimentées par l'IA et les solutions de blockchain, le toast ne s'adapte pas seulement à la dynamique changeante de l'industrie de la restauration - elle les remodeler activement. Préparez-vous à plonger dans un plan stratégique qui promet de redéfinir comment les restaurants exploitent la technologie pour une efficacité opérationnelle et une croissance sans précédent.
Toast, Inc. (TOST) - Matrice Ansoff: pénétration du marché
Développer l'adoption des logiciels de restauration
Toast, Inc. a rapporté 74 000 clients de restaurants au quatrième trimestre 2022, ce qui représente une croissance de 31% d'une année à l'autre de l'adoption des plateformes.
| Métrique | Valeur | Année |
|---|---|---|
| Total des clients des restaurants | 74,000 | 2022 |
| Croissance d'une année à l'autre | 31% | 2022 |
Augmenter la vente croisée des outils de paiement et de gestion
Le toast a généré 1,71 milliard de dollars de revenus pour 2022, avec des solutions de paiement représentant 51% des revenus totaux.
- Revenus de solutions de paiement: 872,1 millions de dollars
- Revenus de plateforme de technologie de restauration totale: 1,71 milliard de dollars
Améliorer la fidélisation de la clientèle
Toast a déclaré un taux net de rétention des revenus de 116% au quatrième trimestre 2022, indiquant une forte expansion et rétention des clients.
| Métrique de rétention | Pourcentage |
|---|---|
| Taux de rétention des revenus nets | 116% |
Offrir des prix compétitifs
Le matériel de Toast commence à 79 $ par mois, avec des abonnements logiciels allant de 0 $ à 165 $ par mois.
Développer des campagnes de marketing ciblées
Les dépenses de marketing pour les toasts étaient de 239,1 millions de dollars en 2022, ce qui représente 14% des revenus totaux.
| Dépenses de marketing | Montant | Pourcentage de revenus |
|---|---|---|
| Dépenses marketing totales | 239,1 millions de dollars | 14% |
Toast, Inc. (TOST) - Matrice Ansoff: développement du marché
Développez la couverture géographique à travers les segments du marché des restaurants américains
Au quatrième trimestre 2022, Toast, Inc. a fonctionné dans 48 États américains avec 57 000 clients de restauration. La taille du marché des technologies des restaurants était de 16,4 milliards de dollars en 2022, prévoyant une atteinte à 23,7 milliards de dollars d'ici 2027.
| Segment de marché | Couverture actuelle | Croissance potentielle |
|---|---|---|
| Restaurants à service rapide | 38% de pénétration du marché | Expansion potentielle de 62% |
| Gastronomie | 22% de couverture du marché | 45% de croissance potentielle |
| Restauration | 15% de part de marché | 35% d'expansion potentielle |
Target des restaurants spécifiques verticaux
Taux d'adoption des technologies des restaurants: restaurants à service rapide 65%, gastronomie 42%, restauration de 28%.
- Restaurants à service rapide: 350 000 établissements au total aux États-Unis
- Fine cuisine: 90 000 établissements au total aux États-Unis
- Catering: 75 000 établissements totaux aux États-Unis
Développer des stratégies de vente localisées
Dépenses de technologie des restaurants régionaux: nord-est 4,2 milliards de dollars, 3,8 milliards de dollars à l'ouest, sud-est de 3,5 milliards de dollars, Midwest 2,9 milliards de dollars.
Explorer l'entrée du marché international
Focus initial sur les pays anglophones: Marché des technologies des restaurants du Canada 1,6 milliard de dollars, Royaume-Uni 2,3 milliards de dollars, Australie 980 millions de dollars.
Créer des partenariats stratégiques
Adhésions à l'association des restaurants: National Restaurant Association 500 000 membres, Associations de restauration d'État 52 organisations actives.
| Réseau de partenariat | Total des membres | Portée potentielle |
|---|---|---|
| Associations de restaurants régionaux | 52 associations | 375 000 restaurants |
| Réseaux d'accueil | 28 réseaux majeurs | 250 000 entreprises hôtelières |
Toast, Inc. (TOST) - Matrice Ansoff: développement de produits
Outils d'analyse et de rapports avancés à AI AI
Au deuxième trimestre 2022, Toast a investi 12,4 millions de dollars dans le développement de l'analyse de l'IA. La plate-forme a traité 67 millions de transactions de restaurants en 2022, générant 1,89 milliard de dollars de volume de paiement total.
| Investissement d'analyse AI | Volume de transaction | Impact sur les revenus |
|---|---|---|
| 12,4 millions de dollars | 67 millions de transactions | Volume de paiement de 1,89 milliard de dollars |
Gestion des stocks et optimisation de la chaîne d'approvisionnement
Toast a développé des modules d'inventaire spécialisés qui ont réduit les déchets alimentaires de 22% pour les clients des restaurants. La plate-forme prend en charge 74 000 emplacements de restaurants à travers l'Amérique du Nord.
- Réduction des déchets alimentaires: 22%
- Emplacements des restaurants soutenus: 74 000
- Économies d'optimisation de la chaîne d'approvisionnement: 0,37 $ par transaction
Caractéristiques du marketing et de l'engagement client
La plateforme de marketing de Toast a généré 580 millions de dollars de revenus supplémentaires pour les clients des restaurants en 2022. Les outils d'engagement client ont augmenté les tarifs des clients de 18%.
| Revenus supplémentaires | Augmentation répétée des clients |
|---|---|
| 580 millions de dollars | 18% |
Solutions mobiles-d'abord
L'utilisation de la plate-forme mobile a augmenté à 52% du total des transactions en 2022. Le volume de commande mobile a atteint 1,3 million de transactions quotidiennes.
Solutions émergentes de technologie des restaurants
Toast a investi 8,7 millions de dollars dans le développement de la technologie de la cuisine fantôme. La plate-forme prend en charge 3 200 sites de cuisine fantôme à l'échelle nationale.
| Investissement technologique | Emplacements de la cuisine fantôme |
|---|---|
| 8,7 millions de dollars | 3 200 emplacements |
Toast, Inc. (TOST) - Matrice Ansoff: diversification
Explorez les services technologiques adjacents pour les industries de l'hôtellerie et de la vente au détail
Toast, Inc. a déclaré 1,58 milliard de dollars de revenus totaux pour 2022, avec une croissance de 32% sur les services de technologie des restaurants. La société dessert 85 000 emplacements de restaurants à travers les États-Unis.
| Catégorie de service | Taille du marché potentiel | Potentiel de revenus estimé |
|---|---|---|
| Services techniques hôteliers | 12,4 milliards de dollars | 385 millions de dollars |
| Solutions de technologie de vente au détail | 8,7 milliards de dollars | 276 millions de dollars |
Développer des services de conseil en tirant parti des données de la plate-forme et de l'expertise de gestion des restaurants
La plate-forme de Toast traite 97 milliards de dollars en volume de paiement annuel. Les informations sur les données de l'entreprise pourraient générer des sources de revenus de consultation potentielles.
- Valeur de l'engagement de consultation moyen: 75 000 $
- Marché du conseil annuel potentiel: 450 millions de dollars
- Marges de service de conseil estimées: 65-72%
Créer des plateformes de formation et d'éducation pour la technologie et la gestion des restaurants
Le marché de la formation en technologie des restaurants est estimé à 1,2 milliard de dollars par an.
| Programme de formation | Public cible | Revenus annuels estimés |
|---|---|---|
| Certification de gestion numérique | Chefs de restauration | 48 millions de dollars |
| Cours de mise en œuvre de la technologie | Propriétaires de restaurants | 36 millions de dollars |
Investissez dans des acquisitions potentielles de startups technologiques complémentaires
Les équivalents en espèces et en espèces de Toast au 31 décembre 2022: 346,4 millions de dollars
- Budget d'acquisition potentiel: 200 à 250 millions de dollars
- Plage d'évaluation des startups cibles: 50 à 100 millions de dollars
- Secteurs de technologie préférés: IA, apprentissage automatique, traitement des paiements
Développer des solutions de blockchain ou de blockchain pour la gestion de la chaîne d'approvisionnement des restaurants
Marché mondial des technologies de gestion de la chaîne d'approvisionnement: 4,8 milliards de dollars en 2022
| Blockchain | Segment de marché potentiel | Valeur marchande estimée |
|---|---|---|
| Suivi de la chaîne d'approvisionnement | Gestion des stocks de restaurants | 620 millions de dollars |
| Vérification du paiement du fournisseur | Systèmes d'approvisionnement | 480 millions de dollars |
Toast, Inc. (TOST) - Ansoff Matrix: Market Penetration
You're looking at how Toast, Inc. (TOST) plans to capture more of the market it already serves. This is about selling more of the existing platform to the existing restaurant segment, which is still massive, even with their current scale.
The core of this strategy is aggressively targeting the remaining 80% of US restaurants not yet on a modern POS system. Based on Toast, Inc. estimates, the total addressable market (TAM) for their solutions in the U.S. is approximately 875,000 restaurants. With Toast serving approximately 156,000 total locations as of the end of Q3 2025, this leaves a substantial runway for pure domestic penetration. The company is focused on executing the same algorithm, sustaining consistent market share gains in its core U.S. segment. This focus is evident as U.S. SMB net additions in 2025 are expected to be in a similar range as 2024. The company has a clear path to doubling its market share in the core U.S. SMB business.
To win over these remaining operators, the plan involves tactical pricing moves, such as offering deeper discounts or extended free trials to high-volume, independent restaurants. This push for adoption is supported by scaling the direct sales force. The plan calls to increase sales team headcount by 15% to drive adoption in existing metro areas. For context, Toast, Inc. had a total employee count of 5,700 in fiscal year 2025.
Market penetration isn't just about new logos; it's about deepening the relationship with the existing base to increase the value extracted per customer. The strategy here is to bundle payroll and lending services to increase average revenue per user (ARPU) by 5%. We see evidence of ARPU expansion already occurring in other segments; for instance, International SaaS ARPU was up 20% year-over-year as of Q3 2025. Furthermore, implementing a loyalty program for existing customers is a key lever to drive referrals and reduce churn below 1.5% monthly. Industry data suggests that POS providers can face annual customer churn rates around 20%, making a sub-1.5% monthly target a significant operational goal.
Here are some key metrics showing the current scale and momentum driving this penetration strategy:
- Annual Recurring Revenue (ARR) surpassed $2.0 billion as of September 30, 2025.
- Net locations added in Q3 2025 were approximately 7,500.
- Total locations on the platform reached 156,000 at the end of Q3 2025.
- FY 2025 Adjusted EBITDA guidance is set between $610 million and $620 million.
- FY 2024 Revenue was reported at $4.96 billion.
The financial impact of successfully deepening relationships is measurable through the platform's overall performance, as seen in the Q3 2025 results:
| Metric | Value (Q3 2025) | Context/Comparison |
| Adjusted EBITDA | $176 million | Margins expanded to 35%. |
| Free Cash Flow (FCF) | $153 million | Nearly 100% conversion from adjusted EBITDA. |
| GAAP Net Income | $105 million | Reported for the quarter. |
| SaaS ARR Growth (YoY) | 28% | Driven by location growth and mid-single-digit SaaS ARPU increase. |
You need to watch the execution on the ground, as the success of these penetration tactics directly fuels the next level of financial performance. Finance: draft 13-week cash view by Friday.
Toast, Inc. (TOST) - Ansoff Matrix: Market Development
Toast, Inc. is executing Market Development by expanding its existing platform into new geographic territories and new customer segments within the food service ecosystem. As of Q2 2025, Toast reported serving approximately 148,000 total locations, with its international team having launched its first customer in Australia. The company explicitly lists service regions including the United Kingdom (English), Ireland (English), and Canada (English) on its website, indicating established market entry points beyond the core United States operations.
The push into new geographies is showing early traction. By the end of Q2 2025, Toast crossed 10,000 live locations across its enterprise, international, and food and beverage retail segments combined. These new market segments are specifically on track to surpass $100 million in ARR (Annual Recurring Revenue) collectively by the end of 2025.
For adapting the platform to different restaurant types, Toast is moving upmarket, evidenced by welcoming Firehouse Subs, a 1,300+ unit QSR enterprise brand, onto the platform in Q2 2025. This demonstrates platform capability for large-scale, quick-service operations outside the traditional independent restaurant base.
The following table summarizes key financial metrics as of the latest reported periods in 2025, showing the scale supporting this expansion:
| Metric | Value (As of Q2/Q3 2025) | Period/Date |
| TTM Revenue | $5.858B | Twelve Months ending September 30, 2025 |
| Quarterly Revenue | $1.63B | Q3 2025 |
| Annual Recurring Revenue (ARR) | Over $2.0 billion | Q3 2025 |
| Total Locations | 156,000 | Q3 2025 |
| Adjusted EBITDA | $161 million | Q2 2025 |
| New Locations Added (Q2 2025) | 8,500 net new | Q2 2025 |
Regarding strategic partnerships and regulatory tailoring, Toast announced a multi-year partnership with American Express focused on enhancing hospitality experiences across its network in the United States. The company also released Toast Go® 3, its most powerful handheld device yet, in Q2 2025. Furthermore, the internal data tool, Toast IQ, has seen strong adoption, with over 25,000 restaurants using it more than 235,000 times since its early October rollout. While specific details on establishing partnerships with local payment processors in Europe or APAC, or the exact modifications made to Toast Go® for non-US regulations, are not explicitly detailed with financial figures, the company's active presence in international markets suggests these localization efforts are underway.
For targeting non-traditional venues in the US, Toast is deepening its commitment to the food and beverage retail community in 2025, showcasing its retail solution for convenience stores, bottle shops, and grocers. This segment, alongside enterprise and international, contributed to the 10,000+ live locations milestone in Q2 2025. The platform is designed to serve these retail concepts, which, according to a recent Toast study, see more than half offering some form of foodservice.
The Market Development strategy involves several concurrent actions:
- Geographic expansion confirmed in Ireland, UK, and Australia.
- Targeting large QSR chains, onboarding a 1,300+ unit brand in Q2 2025.
- New segment ARR on track to exceed $100 million by year-end 2025.
- New hardware release, Toast Go® 3, in Q2 2025.
- Adoption of Toast IQ by over 25,000 restaurants.
Finance: review the Q3 2025 international segment revenue contribution against the $100 million ARR target by Friday.
Toast, Inc. (TOST) - Ansoff Matrix: Product Development
Launch a fully integrated, AI-powered inventory management and waste reduction module.
The AI Assistant, Toast IQ, saw adoption with over 25,000 restaurants using it. This tool recorded more than 235,000 uses just since early October.
Introduce a dedicated, high-margin financial product, like a merchant cash advance program, to boost FinTech revenue.
Payments Annual Recurring Revenue (ARR) increased 31% year-over-year as of Q3 2025. The company expects full year 2025 Non-GAAP subscription services and financial technology solutions gross profit in the range of $1,865 million to $1,875 million.
Develop a full-service human resources (HR) management suite to compete with dedicated HR software.
The platform supports 156,000 total locations globally as of September 30, 2025. Major enterprise wins include rolling out to nearly 200 Nordstrom dining locations and securing the entire TGI Fridays US operation.
Create a consumer-facing app that aggregates all Toast-powered restaurants for ordering and loyalty.
A strategic partnership was formed to integrate Toast Tables reservations into the Local by Toast app.
Offer a premium, enterprise-grade reporting and analytics dashboard for multi-location chains.
The company crossed 10,000 live locations across its enterprise, food & beverage retail, and international segments as of Q2 2025. International ARR has crossed $100 million.
Here's a quick look at the platform's scale underpinning these product expansions:
| Metric | Value (As of Q3 2025 or Latest Reported) | Context |
| Total Locations | 156,000 | Global footprint as of September 30, 2025 |
| Annual Recurring Revenue (ARR) | $2.0 billion | Crossed this milestone as of September 30, 2025 |
| Q3 2025 GAAP Subscription & FinTech Gross Profit | $490 million | Year-over-year growth of 34% |
| Q3 2025 Adjusted EBITDA | $176 million | Represented a 35% margin |
| Q3 2025 Net Location Adds | 7,500 | Net additions for the quarter |
Other recent product developments include new SMS features and AI-Marketing Assistant automations within Marketing Essentials. The Test Kitchen is exploring features like Toast Tables Prepayment and Calculated Guest Count.
- New SMS features allow uploading previously subscribed guests.
- Loyalty development includes Tiered rewards.
- New management tools for third-party ordering with DoorDash and Uber Eats were released.
The Toast Go 3 handheld, featuring built-in cellular connectivity, was introduced to improve order speed.
Toast, Inc. (TOST) - Ansoff Matrix: Diversification
You're looking at Toast, Inc. (TOST) moving beyond its core restaurant market, which is the classic definition of diversification in the Ansoff Matrix. This means entering new markets with new products, a strategy that requires capital deployment but offers the highest potential for long-term market expansion. Right now, Toast is operating at a significant scale, which provides the financial base for such moves. For the third quarter ended September 30, 2025, Toast reported Annual Recurring Revenue (ARR) of $2.0 billion, marking a 30% year-over-year increase. The platform powered approximately 156,000 total locations, a 23% increase YOY. This scale, coupled with a Q3 2025 GAAP net income of $105 million and Free Cash Flow of $153 million, shows the operational strength to fund new ventures.
Consider the potential for acquiring a complementary hospitality software company focused on the hotel or lodging sector. While Toast has secured marquee enterprise wins, such as rolling out its platform to nearly 200 Nordstrom cafes and restaurants and moving TGI Fridays' entire U.S. operation onto the platform, a dedicated hotel/lodging software acquisition would be a true market jump. This move would target a different operational rhythm than the core Quick Service Restaurant (QSR) or full-service restaurant segment. The financial health supports this: Non-GAAP subscription services and financial technology solutions gross profit for Q3 2025 was $506 million.
Developing a point-of-sale (POS) system specifically for non-food retail, like specialty grocery or small boutiques, is another diversification path. Toast's existing technology, built on Android, could be adapted. The payments infrastructure is already massive, with Gross Payment Volume (GPV) hitting $51.5 billion in Q3 2025. This suggests the payment processing backbone is robust enough to handle different retail transaction types. Here's a quick look at the current platform's financial performance that could fund this R&D:
| Metric (Q3 2025) | Amount | YOY Change |
| Total Revenue | $1.63 billion | 25.1% increase |
| Adjusted EBITDA | $176 million | Increase from $113 million in Q3 2024 |
| Payments Net Take Rate | 49 bps | Up 4 bps YoY |
Entering the food supply chain logistics market by connecting restaurants directly to wholesale distributors represents a vertical integration play, moving into a new adjacent service area. This leverages the existing customer base of over 156,000 locations. The focus on data and AI, evidenced by over 25,000 restaurants using Toast IQ more than 235,000 times since early October 2025, shows an existing capability to manage complex data flows that logistics would require.
Creating a B2B marketplace for restaurant equipment and supplies would capitalize directly on the existing customer base. The current scale is 156,000 locations, far exceeding the 110,000 figure you mentioned. This marketplace could be monetized through transaction fees, similar to how the payments segment works. The company's overall take rate reached 98 bps in Q3 2025, indicating success in extracting value from transaction flow.
Finally, offering a certified food safety and compliance training platform as a subscription service is a product development play into a new service category for the existing market. This would be a pure SaaS offering, building on the existing software strength. The SaaS segment is performing well, with GAAP subscription services gross profit at $490 million in Q3 2025, and the SaaS gross margin improved to 79% from 77%. This move would expand the software attachment rate, which is a key focus area for Toast.
- Toast's full-year 2025 Non-GAAP subscription services and financial technology solutions gross profit is guided to be in the range of $1,865 million to $1,875 million.
- The company expects to sustain growth over 20% in 2026.
- Toast Capital gross profit was $58 million in Q3 2025, showing an appetite for new financial product lines.
- The company is investing heavily, with Q4 2025 Adjusted EBITDA guidance set between $140 million and $150 million.
- The overall enterprise segment is showing promise, with new TAMs (Total Addressable Markets) projected by management to become $1 billion ARR contributors.
Finance: draft 13-week cash view by Friday.
Disclaimer
All information, articles, and product details provided on this website are for general informational and educational purposes only. We do not claim any ownership over, nor do we intend to infringe upon, any trademarks, copyrights, logos, brand names, or other intellectual property mentioned or depicted on this site. Such intellectual property remains the property of its respective owners, and any references here are made solely for identification or informational purposes, without implying any affiliation, endorsement, or partnership.
We make no representations or warranties, express or implied, regarding the accuracy, completeness, or suitability of any content or products presented. Nothing on this website should be construed as legal, tax, investment, financial, medical, or other professional advice. In addition, no part of this site—including articles or product references—constitutes a solicitation, recommendation, endorsement, advertisement, or offer to buy or sell any securities, franchises, or other financial instruments, particularly in jurisdictions where such activity would be unlawful.
All content is of a general nature and may not address the specific circumstances of any individual or entity. It is not a substitute for professional advice or services. Any actions you take based on the information provided here are strictly at your own risk. You accept full responsibility for any decisions or outcomes arising from your use of this website and agree to release us from any liability in connection with your use of, or reliance upon, the content or products found herein.