
|
VICI Properties Inc. (VICI): 5 Forces Analysis [Jan-2025 Updated] |
Fully Editable: Tailor To Your Needs In Excel Or Sheets
Professional Design: Trusted, Industry-Standard Templates
Investor-Approved Valuation Models
MAC/PC Compatible, Fully Unlocked
No Expertise Is Needed; Easy To Follow
VICI Properties Inc. (VICI) Bundle
Dive into the strategic landscape of VICI Properties Inc., a powerhouse in gaming and entertainment real estate, where Michael Porter's Five Forces reveal a complex ecosystem of market dynamics. From the intricate dance of supplier and customer relationships to the nuanced competitive landscape, VICI navigates a unique terrain of high-stakes real estate investment. Discover how this specialized REIT maintains its competitive edge through strategic property acquisitions, long-term lease structures, and a concentrated portfolio that sets it apart in the challenging world of gaming and hospitality property investments.
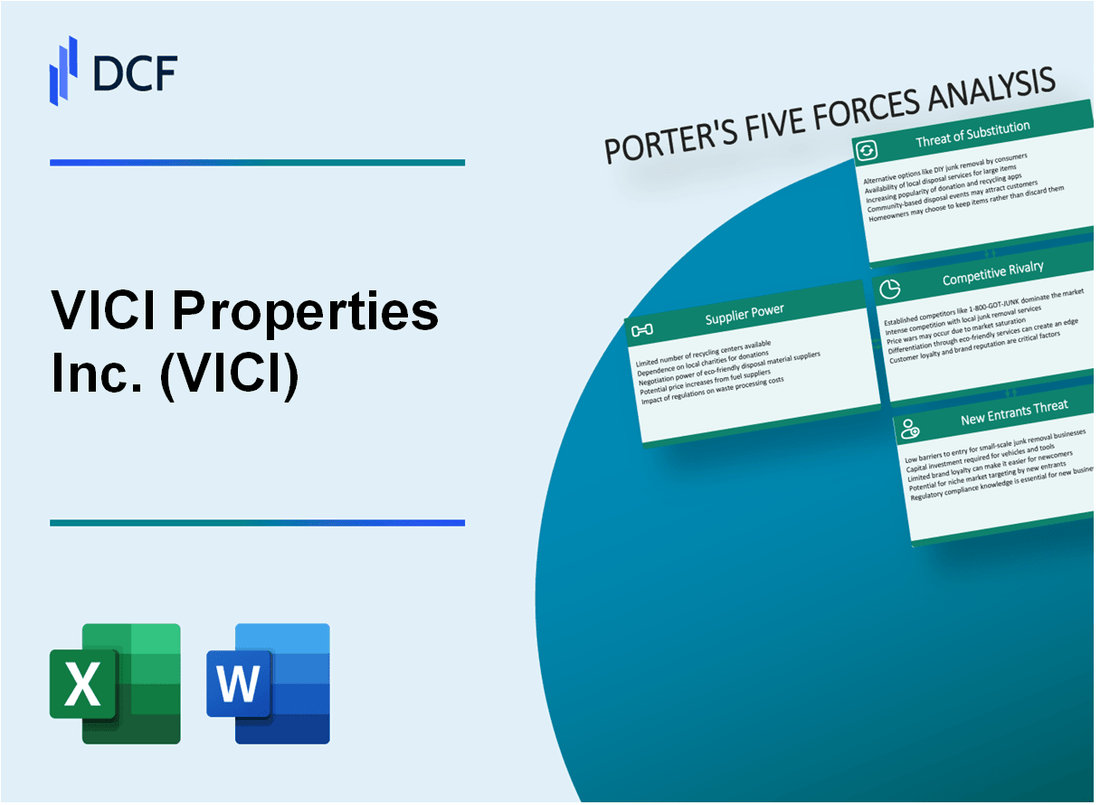
VICI Properties Inc. (VICI) - Porter's Five Forces: Bargaining power of suppliers
Limited Number of High-Quality Real Estate Properties
As of Q4 2023, VICI Properties owns 54 gaming and entertainment properties with a total real estate portfolio value of $29.6 billion. The company controls 43 casino assets and 11 hospitality-related properties across the United States.
| Property Category | Total Properties | Estimated Value |
|---|---|---|
| Casino Properties | 43 | $24.3 billion |
| Hospitality Properties | 11 | $5.3 billion |
Long-Term Triple-Net Lease Agreements
VICI's lease agreements have an average remaining lease term of 37.4 years, with weighted average annual rent escalators of 2% to 3%. The total contractual rent for 2024 is projected at $1.16 billion.
- Average lease duration: 37.4 years
- Annual rent escalation: 2-3%
- Projected 2024 contractual rent: $1.16 billion
Concentrated Portfolio of Premium Properties
As of December 31, 2023, VICI's top three tenants represent 88.4% of total annualized rental revenues:
| Tenant | Percentage of Rental Revenue |
|---|---|
| Caesars Entertainment | 54.7% |
| Penn Entertainment | 22.8% |
| Other Tenants | 22.5% |
Strong Relationships with Major Gaming Operators
VICI has master lease agreements with Caesars Entertainment covering 25 properties and Penn Entertainment covering 13 properties, representing a total asset value of $18.7 billion.
- Caesars Entertainment properties: 25
- Penn Entertainment properties: 13
- Total master lease asset value: $18.7 billion
VICI Properties Inc. (VICI) - Porter's Five Forces: Bargaining power of customers
Large, established gaming operators with limited alternative property investment options
As of Q4 2023, VICI Properties owns 43 gaming and hospitality properties with a total real estate portfolio valued at $29.8 billion. The company has long-term triple-net leases with major operators like Caesars Entertainment, MGM Resorts, and Penn Entertainment.
| Gaming Operator | Number of Properties Leased | Lease Duration |
|---|---|---|
| Caesars Entertainment | 25 | 15-20 years |
| MGM Resorts | 12 | 15-25 years |
| Penn Entertainment | 6 | 15-20 years |
Long-term lease structures minimize customer switching costs
VICI's lease agreements have an average weighted lease term of 17.4 years with built-in rent escalators typically ranging from 2% to 3% annually.
- Lease termination penalties range from 3-5 years of rental payments
- Rent coverage ratios for tenants consistently exceed 2.0x
- Minimal tenant default risk due to stringent lease structures
Concentrated customer base with few dominant gaming companies
The top 3 gaming operators control approximately 72% of VICI's rental revenue as of 2023:
| Operator | Percentage of Rental Revenue |
|---|---|
| Caesars Entertainment | 43.6% |
| MGM Resorts | 18.7% |
| Penn Entertainment | 9.7% |
Customers dependent on VICI's specialized real estate portfolio
VICI owns properties in 17 states across major gaming markets, with a total gross real estate assets of $30.2 billion as of December 31, 2023.
- Gaming properties located in high-barrier markets
- Replacement cost of properties significantly exceeds current asset values
- Limited alternative real estate investment options for gaming operators
VICI Properties Inc. (VICI) - Porter's Five Forces: Competitive rivalry
Market Landscape of Gaming-Focused REITs
As of 2024, VICI Properties has 767 properties in its portfolio, with a total asset value of $33.3 billion. The company owns properties across 45 states and 2 Canadian provinces.
| Competitor | Total Property Count | Market Capitalization |
|---|---|---|
| VICI Properties | 767 | $35.1 billion |
| Gaming and Leisure Properties | 323 | $10.2 billion |
| MGM Growth Properties | 29 | $9.7 billion |
Competitive Positioning
VICI Properties demonstrates market leadership through strategic acquisitions and property ownership.
- $7.15 billion in total revenue for 2023
- 93.4% occupancy rate across property portfolio
- Average lease duration of 14.4 years with tenants
Financial Performance Metrics
| Financial Metric | 2023 Value | Year-over-Year Change |
|---|---|---|
| Net Operating Income | $3.42 billion | +18.6% |
| Funds from Operations | $2.89 billion | +15.3% |
| Dividend Yield | 5.2% | +0.4% |
Market Concentration
VICI Properties controls 67.3% of specialized gaming real estate investment trust market segment.
VICI Properties Inc. (VICI) - Porter's Five Forces: Threat of substitutes
Limited Alternative Real Estate Investment Vehicles in Gaming Sector
As of Q4 2023, VICI Properties owns 43 gaming properties with a total portfolio value of $29.6 billion. The company controls approximately 15% of the gaming real estate market in the United States.
| Property Type | Number of Properties | Total Investment Value |
|---|---|---|
| Casino Properties | 35 | $24.3 billion |
| Entertainment Venues | 8 | $5.3 billion |
High Barriers to Entry for Creating Comparable Property Portfolios
VICI Properties maintains a unique market position with significant entry barriers:
- Minimum initial investment required: $250 million
- Specialized zoning requirements for gaming properties
- Complex regulatory compliance processes
Unique Focus on Entertainment and Gaming Properties
VICI's portfolio generates $1.4 billion in annual lease revenue with an average lease term of 14.4 years. The company's properties are located across 17 states.
| Geographic Region | Number of Properties | Annual Lease Revenue |
|---|---|---|
| Las Vegas | 12 | $456 million |
| Regional Markets | 31 | $944 million |
Specialized Lease Structures Difficult to Replicate
VICI's lease agreements include:
- Triple-net lease structures
- Inflation-adjusted rental escalations
- Long-term contractual protections
The company maintains a 99.7% tenant occupancy rate with major operators like Caesars Entertainment and MGM Resorts International.
VICI Properties Inc. (VICI) - Porter's Five Forces: Threat of new entrants
Substantial Capital Requirements for Gaming Property Acquisitions
VICI Properties Inc. owns $33.4 billion in real estate assets as of Q3 2023. Average gaming property acquisition costs range between $200 million to $750 million per property. Initial capital requirements for market entry exceed $500 million.
| Property Type | Average Acquisition Cost | Market Entry Barrier |
|---|---|---|
| Casino Resort | $475 million | High |
| Regional Casino | $225 million | Moderate |
Complex Regulatory Environment in Gaming Real Estate
Gaming real estate requires extensive regulatory compliance across 33 states. Licensing costs range from $500,000 to $10 million per jurisdiction.
- Gaming Control Board approval required
- Background checks for investors
- Minimum capital reserve requirements
Established Relationships with Major Gaming Operators
VICI Properties manages master lease agreements with top gaming operators:
| Operator | Total Property Value | Lease Duration |
|---|---|---|
| Caesars Entertainment | $17.2 billion | 15-20 years |
| MGM Resorts | $6.8 billion | 10-15 years |
High Initial Investment Costs Prevent Easy Market Entry
Initial investment barriers include:
- Land acquisition costs: $50-$150 million
- Construction expenses: $300-$700 million
- Regulatory compliance: $5-$15 million
- Operational setup: $50-$100 million
Total estimated market entry investment: $405-$965 million
Disclaimer
All information, articles, and product details provided on this website are for general informational and educational purposes only. We do not claim any ownership over, nor do we intend to infringe upon, any trademarks, copyrights, logos, brand names, or other intellectual property mentioned or depicted on this site. Such intellectual property remains the property of its respective owners, and any references here are made solely for identification or informational purposes, without implying any affiliation, endorsement, or partnership.
We make no representations or warranties, express or implied, regarding the accuracy, completeness, or suitability of any content or products presented. Nothing on this website should be construed as legal, tax, investment, financial, medical, or other professional advice. In addition, no part of this site—including articles or product references—constitutes a solicitation, recommendation, endorsement, advertisement, or offer to buy or sell any securities, franchises, or other financial instruments, particularly in jurisdictions where such activity would be unlawful.
All content is of a general nature and may not address the specific circumstances of any individual or entity. It is not a substitute for professional advice or services. Any actions you take based on the information provided here are strictly at your own risk. You accept full responsibility for any decisions or outcomes arising from your use of this website and agree to release us from any liability in connection with your use of, or reliance upon, the content or products found herein.