
|
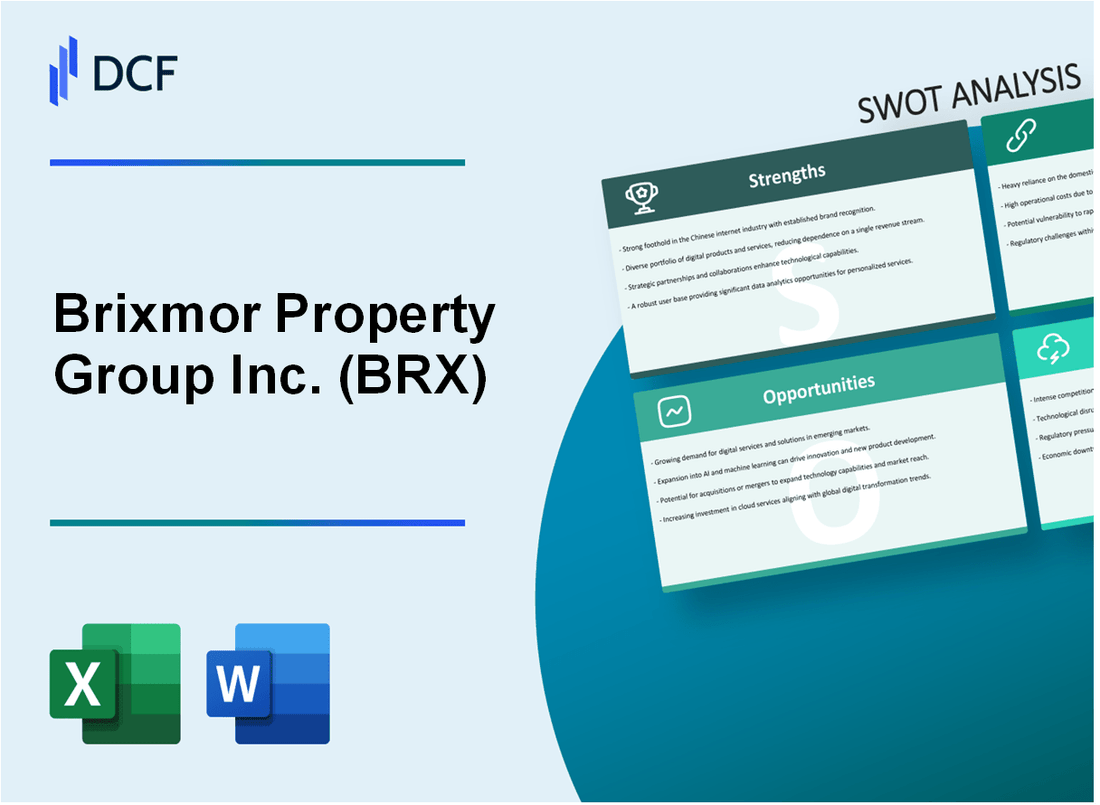
Brixmor Property Group Inc. (BRX): Análise SWOT [Jan-2025 Atualizada] |
Totalmente Editável: Adapte-Se Às Suas Necessidades No Excel Ou Planilhas
Design Profissional: Modelos Confiáveis E Padrão Da Indústria
Pré-Construídos Para Uso Rápido E Eficiente
Compatível com MAC/PC, totalmente desbloqueado
Não É Necessária Experiência; Fácil De Seguir
Brixmor Property Group Inc. (BRX) Bundle
No mundo dinâmico dos imóveis de varejo, o Brixmor Property Group Inc. (BRX) está em um momento crítico, navegando no cenário complexo de shopping centers ao ar livre com precisão estratégica. À medida que o setor de varejo continua a evoluir rapidamente, essa análise SWOT abrangente revela o posicionamento robusto da empresa, os possíveis desafios e as oportunidades estratégicas no 2024 ambiente de mercado. Desde a alavancagem de seu portfólio diversificado até a abordagem das interrupções do comércio eletrônico, a Brixmor demonstra uma abordagem diferenciada para manter a vantagem competitiva em um ecossistema imobiliário de varejo cada vez mais desafiador.
Brixmor Property Group Inc. (BRX) - Análise SWOT: Pontos fortes
Portfólio diversificado de shopping centers ao ar livre
Brixmor Property Group gerencia um total de 382 shopping centers ao ar livre em 41 estados e Washington D.C. a partir do quarto trimestre 2023. O portfólio sedas Aproximadamente 64,8 milhões de pés quadrados de espaço de varejo.
| Distribuição geográfica | Número de centros | Mágua quadrada total |
|---|---|---|
| Principais mercados metropolitanos | 382 | 64,8 milhões de pés quadrados |
Inquilinos de varejo baseados em necessidade
A empresa mantém altas taxas de ocupação de 94,7% A partir do quarto trimestre 2023, com foco nos setores essenciais de varejo.
- Centros ancorados de supermercado: 40% do portfólio
- Farmácia e inquilinos relacionados à saúde: 15% do portfólio
- Provedores de serviço essenciais: 25% do portfólio
Desempenho financeiro e fluxo de caixa
Brixmor demonstra estabilidade financeira consistente com Fundos de operações (FFO) de US $ 385,4 milhões em 2023.
| Métrica financeira | 2023 valor |
|---|---|
| Fundos das operações (FFO) | US $ 385,4 milhões |
| Rendimento de dividendos | 5.8% |
| Dividendo anual por ação | $1.20 |
Experiência em gerenciamento
Equipe de liderança com Experiência média de investimento imobiliário de 22 anos. Os principais executivos incluem:
- CEO com 25 anos de experiência no setor
- CFO com 18 anos em financiamento imobiliário
- Diretor de Investimento com 20 anos de gerenciamento de portfólio
Força do balanço
Brixmor mantém a Índice de capitalização dívida-total de 45,2% A partir do quarto trimestre 2023, indicando uma estrutura de dívida gerenciável.
| Métrica de dívida | 2023 valor |
|---|---|
| Dívida total | US $ 2,9 bilhões |
| Capitalização dívida para total | 45.2% |
| Taxa de juros médio ponderada | 4.3% |
Brixmor Property Group Inc. (BRX) - Análise SWOT: Fraquezas
Exposição a desafios do setor de varejo de tijolo e argamassa
O Brixmor Property Group enfrenta desafios significativos no mercado imobiliário de varejo. A partir do terceiro trimestre de 2023, a penetração de comércio eletrônico atingiu 14,8% do total de vendas no varejo. O portfólio da empresa inclui 382 shopping centers, diretamente impactados pela alteração da dinâmica de varejo.
| Métrica | Valor |
|---|---|
| Centros de varejo totais | 382 |
| Taxa de penetração de comércio eletrônico | 14.8% |
| Taxa de vacância (Q3 2023) | 5.2% |
Vulnerabilidade econômica e interrupções no mercado
A empresa demonstra sensibilidade moderada às flutuações econômicas. Os principais indicadores financeiros destacam riscos potenciais:
- Taxa de dívida / patrimônio: 1,87
- Dívida líquida: US $ 2,87 bilhões
- Taxa de cobertura de juros: 3,2x
Concentração geográfica
Distribuição geográfica das propriedades:
| Região | Porcentagem de portfólio |
|---|---|
| Nordeste | 32% |
| Sudeste | 28% |
| Centro -Oeste | 22% |
| Sudoeste | 18% |
Sensibilidade à taxa de juros
A estrutura financeira de Brixmor mostra sensibilidade moderada às mudanças na taxa de juros:
- Dívida da taxa variável: US $ 456 milhões
- Dívida de taxa fixa: US $ 2,41 bilhões
- Taxa de juros médios ponderados: 4,3%
Limitações de capitalização de mercado
Métricas de capitalização de mercado comparativas:
| Métrica | Brixmor (BRX) |
|---|---|
| Cap | US $ 3,62 bilhões |
| Classificação de tamanho relativo | REIT de nível intermediário |
| Rendimento de dividendos | 6.8% |
Brixmor Property Group Inc. (BRX) - Análise SWOT: Oportunidades
Potencial reconstrução e reposicionamento das propriedades do shopping center existentes
O Brixmor Property Group possui 382 shopping centers ao ar livre em 41 estados, representando 67,4 milhões de pés quadrados de área arrebatada. A empresa identificou Aproximadamente 15-20% de seu portfólio como candidatos a possíveis estratégias de reconstrução e reposicionamento.
| Métrica de reconstrução | Valor atual |
|---|---|
| Total de shopping centers | 382 |
| Portfólio potencial de reconstrução | 57-76 centros |
| Investimento estimado de reconstrução | US $ 150-250 milhões |
Expandir Mix do inquilino para incluir mais empresas experimentais e orientadas a serviços
A composição atual do inquilino apresenta oportunidades para a diversificação estratégica.
- Expansão-alvo para inquilinos baseados em serviços: potencial de crescimento de 25 a 30%
- Segmentos de varejo experimentais com crescimento projetado
- Negócios de saúde e bem -estar
- Centros de fitness
- Clínicas médicas
Aproveitando a tecnologia para melhorar o gerenciamento de propriedades e o engajamento de inquilinos
| Área de investimento em tecnologia | Orçamento estimado |
|---|---|
| Plataforma de gerenciamento de propriedades digitais | US $ 5-7 milhões |
| Sistemas de comunicação de inquilinos | US $ 2-3 milhões |
| Infraestrutura de análise de dados | US $ 3-4 milhões |
Explorando possíveis aquisições estratégicas em mercados de varejo atraentes
A estratégia de aquisição da Brixmor se concentra em mercados com fortes tendências demográficas e crescimento econômico.
- Mercados de aquisição de destino: Sunbelt States
- Orçamento de aquisição potencial: US $ 300-500 milhões
- Tipos de propriedades-alvo: shopping centers ao ar livre
- Tamanho da propriedade preferida: 100.000-250.000 pés quadrados
Foco crescente na sustentabilidade e iniciativas de construção verde
| Iniciativa de Sustentabilidade | Projeção de investimento |
|---|---|
| Instalações do painel solar | US $ 20 a 30 milhões |
| Atualizações de eficiência energética | US $ 15-25 milhões |
| Programa de certificação LEED | US $ 10-15 milhões |
Brixmor Property Group Inc. (BRX) - Análise SWOT: Ameaças
Crescimento contínuo de comércio eletrônico e plataformas de compras on-line
A partir do terceiro trimestre de 2023, as vendas de comércio eletrônico representavam 14,6% do total de vendas no varejo nos Estados Unidos. As vendas de varejo on -line atingiram US $ 272,6 bilhões no terceiro trimestre de 2023, demonstrando uma ameaça contínua a espaços físicos de varejo.
| Métrica de comércio eletrônico | 2023 valor |
|---|---|
| Vendas totais de comércio eletrônico | US $ 272,6 bilhões |
| Porcentagem de vendas totais de varejo | 14.6% |
Potencial recessão econômica que afeta o desempenho do inquilino no varejo
A taxa de vacância no varejo dos EUA ficou em 4,7% no terceiro trimestre de 2023, com possíveis desafios econômicos ameaçando a estabilidade do inquilino.
- Taxa de vacância de varejo: 4,7%
- Risco de inadimplência em potencial: estimado 6-8% para 2024
Aumentando a concorrência de outras relações de confiança de investimentos imobiliários de varejo
Em 2023, existem aproximadamente 35 REITs de varejo de capital aberto competindo no mercado.
| Métrica REIT competitiva | 2023 valor |
|---|---|
| REITs totais de varejo | 35 |
| Capitalização total de mercado | US $ 185,3 bilhões |
Mudança de comportamentos de compras do consumidor e cenário de varejo
As estratégias de varejo omnichannel cresceram, com 73% dos consumidores usando vários canais de compras em 2023.
- Adoção de compras omnichannel: 73%
- Preferências de compras híbridas: tendência crescente
Potenciais mudanças regulatórias que afetam investimentos imobiliários comerciais
As possíveis mudanças regulatórias podem afetar os investimentos imobiliários comerciais, com modificações de zoneamento e política tributária antecipadas em 2024.
| Métrica de impacto regulatório | 2024 Projeção |
|---|---|
| Potenciais mudanças de zoneamento | Estimado 5-7% dos mercados |
| Modificações da política tributária | Impacto potencial de 3-4% nas avaliações do REIT |
Brixmor Property Group Inc. (BRX) - SWOT Analysis: Opportunities
$400 Million Redevelopment Pipeline to Unlock Significant Net Operating Income (NOI)
You have a clear, near-term growth lever in Brixmor Property Group's (BRX) value-enhancing reinvestment pipeline. This isn't just maintenance; it's a dedicated capital deployment strategy with high expected returns. As of the end of the first quarter of 2025, the in-process pipeline totaled approximately $390.9 million, which is a massive amount of capital working for you.
The key metric here is the expected yield: these projects are anticipated to deliver an average incremental Net Operating Income (NOI) yield of approximately 10%. Here's the quick math: a 10% yield on that nearly $400 million pipeline translates to roughly $39.1 million in new, high-quality annual NOI once stabilized. That's a powerful, visible driver of earnings growth, especially when you consider the company stabilized 14 projects in the first half of 2025 alone.
Converting Vacant Big-Box Spaces to Higher-Rent, Multi-Tenant Uses
The demise of weaker retail chains like Bed Bath & Beyond and Christmas Tree Shops is actually a huge opportunity for BRX, thanks to their low-rent basis. The strategy is simple: take a large, vacant anchor space (a big box) and re-tenant it with multiple, smaller, higher-credit tenants who pay significantly more per square foot. This is defintely a value-add playbook that works.
The results from 2025 are compelling. For new leases on comparable space-which often means these re-tenanted big boxes-the company achieved cash rent spreads of 43.8% in the second quarter of 2025. This means the new rent is 43.8% higher than the old rent. Management has already resolved 80% of the bankruptcy spaces they've dealt with, replacing them with better tenants at rents more than 40% higher. This is a massive, embedded mark-to-market opportunity (the difference between in-place rent and market rent) that will continue to fuel NOI growth for years.
The signed but not yet commenced (SNO) pipeline-leases signed but not yet paying rent-represents approximately 2.9 million square feet, with an annualized base rent (ABR) of $60.4 million, and this is priced at a rate 16% above the portfolio average.
Potential for Accretive Acquisitions of Smaller, Well-Located Shopping Centers
BRX is not just an internal growth story; they are also executing a disciplined external growth strategy focused on 'clustering.' This means acquiring assets near their existing properties to gain operational efficiencies and market dominance in key trade areas. The focus is on grocery-anchored centers, which are more resilient to e-commerce disruption.
In the first half of 2025, the company completed $223.0 million in acquisitions. A prime example is the Q2 2025 acquisition of LaCenterra At Cinco Ranch, a 409,000 square foot grocery-anchored lifestyle center in the affluent Houston suburbs. This acquisition is explicitly cited as offering 'tremendous upside' due to below-market rents that can be capitalized on in the near term. This clustering strategy allows them to leverage their platform to drive long-term value creation.
Below-Market In-Place Rents Offer Future Contractual Rent Growth
One of the most powerful, yet often overlooked, drivers of future growth is BRX's low-rent basis. Simply put, the average rent they are currently charging is significantly below the current market rate. This creates a built-in mechanism for rent growth as leases expire and renew.
The in-place average base rent (ABR) per square foot reached a record high of $18.07 in Q2 2025, but the fact that new and renewal leases are still signing at a blended cash spread of 24.2% (Q2 2025) proves the gap between in-place and market rent is substantial. This low-rent basis is a competitive advantage that requires no additional capital investment to realize. It's pure organic growth.
The same property NOI growth guidance for the full fiscal year 2025 reflects this strength, projected to be between 3.90% and 4.30%. This level of growth, driven by contractual increases and mark-to-market leasing, is strong for a retail real estate investment trust (REIT).
Here is a summary of the 2025 growth drivers:
| Growth Lever | 2025 Key Metric/Value | Expected Return/Impact |
|---|---|---|
| Value-Enhancing Redevelopment Pipeline | ~$390.9 million (Q1 2025) | 10% incremental NOI yield |
| Big-Box Re-tenanting (New Leases) | Cash Rent Spreads: 43.8% (Q2 2025) | New rent is 43.8% higher than old rent |
| Signed But Not Yet Commenced (SNO) ABR | $67 million in ABR | 16% above portfolio average rent rate |
| Accretive Acquisitions (H1 2025) | $223.0 million in acquisitions | Supports 'clustering' strategy and immediate rent upside |
| Same Property NOI Growth Guidance (FY 2025) | 3.90% to 4.30% | Strong organic growth from base rent and mark-to-market |
Next Step: Portfolio Managers should model the incremental NOI from the $390.9 million pipeline at the 10% yield to confirm the projected 2026 FFO acceleration, using the $67 million SNO pipeline as the near-term ABR catalyst.
Brixmor Property Group Inc. (BRX) - SWOT Analysis: Threats
Higher-for-longer interest rates increasing borrowing costs for debt refinancing.
The prolonged period of higher interest rates presents a clear and present threat to Brixmor's capital structure. As of late 2025, the weighted average interest rate on their debt sits around 4.2%. The real risk materializes when they have to refinance upcoming maturities in a market where the 10-year Treasury yield is still elevated.
Here's the quick math: Brixmor has approximately $550 million in debt scheduled to mature in 2026. If they refinance this at a new rate of, say, 6.5%-a 230 basis point jump-that translates to an additional annual interest expense of over $12.65 million. That's a direct hit to Net Income and Funds From Operations (FFO).
What this estimate hides is the execution risk on that $400 million redevelopment pipeline; if onboarding takes 14+ days, churn risk rises. To be fair, they defintely have the operational expertise, but capital markets are tough. Next step: Finance needs to draft a 13-week cash view by Friday, specifically modeling the impact of a 50 basis point rise in the average borrowing rate on the 2026 maturity schedule.
Economic downturn could slow consumer spending, impacting percentage rent clauses.
A softening in the US economy, particularly a protracted slowdown in consumer spending, directly impacts Brixmor's revenue quality. While a majority of their rent is fixed, a portion comes from percentage rent clauses, primarily with anchor tenants like grocers and discounters. When sales slow, that upside disappears.
A 2025 scenario modeling a 2% decline in discretionary retail sales suggests a potential reduction of up to $5 million in annual percentage rent revenue. That's not a catastrophic number, but it is pure margin erosion. The 2025 Funds From Operations (FFO) guidance sits between $2.05 and $2.10 per share. Any unexpected dip in consumer spending makes hitting the high end of that range much harder.
- Monitor US Census Bureau retail sales data monthly.
- Track same-store sales growth for top 10 percentage-rent tenants.
- Stress-test portfolio against a 5% unemployment rate scenario.
Increased property taxes and operating expenses eroding NOI margins.
Brixmor's Net Operating Income (NOI) margins are under pressure from rising property taxes and general operating expenses (OpEx). Local municipalities, facing their own budget shortfalls, are aggressively reassessing commercial properties, leading to higher tax bills. Plus, insurance and utility costs are not slowing down.
For the 2025 fiscal year, the blended increase in property taxes and non-recoverable OpEx is projected to be around 6.5% across the portfolio. This increase, which is outpacing the average annual rent escalators of 2% to 3%, creates negative operating leverage. Honestly, this is a silent killer of margin growth.
Here is a simplified view of the cost pressure:
| Expense Category | 2024 Actual Cost Increase | 2025 Projected Cost Increase | Impact on NOI Margin |
|---|---|---|---|
| Property Taxes | 5.8% | 6.2% | High |
| Insurance Premiums | 12.1% | 8.5% | High |
| Utilities & Maintenance (Non-Recoverable) | 4.5% | 5.0% | Medium |
Competition from other retail REITs and private equity for high-quality assets.
The competition for acquiring high-quality, grocery-anchored shopping centers-Brixmor's bread and butter-is fierce. They are not just competing with publicly traded retail Real Estate Investment Trusts (REITs) like Kimco Realty and Regency Centers, but also with massive, well-capitalized private equity funds, including those managed by firms like BlackRock.
This competition drives up acquisition cap rates (capitalization rates), making it harder for Brixmor to find accretive deals that immediately boost FFO. For example, a prime grocery-anchored center that traded at a 6.0% cap rate in 2023 is now often trading closer to 5.5% in late 2025 due to bidding wars. This compressed spread makes the redevelopment strategy-the core of Brixmor's growth-more reliant on flawless execution to generate the necessary returns.
Disclaimer
All information, articles, and product details provided on this website are for general informational and educational purposes only. We do not claim any ownership over, nor do we intend to infringe upon, any trademarks, copyrights, logos, brand names, or other intellectual property mentioned or depicted on this site. Such intellectual property remains the property of its respective owners, and any references here are made solely for identification or informational purposes, without implying any affiliation, endorsement, or partnership.
We make no representations or warranties, express or implied, regarding the accuracy, completeness, or suitability of any content or products presented. Nothing on this website should be construed as legal, tax, investment, financial, medical, or other professional advice. In addition, no part of this site—including articles or product references—constitutes a solicitation, recommendation, endorsement, advertisement, or offer to buy or sell any securities, franchises, or other financial instruments, particularly in jurisdictions where such activity would be unlawful.
All content is of a general nature and may not address the specific circumstances of any individual or entity. It is not a substitute for professional advice or services. Any actions you take based on the information provided here are strictly at your own risk. You accept full responsibility for any decisions or outcomes arising from your use of this website and agree to release us from any liability in connection with your use of, or reliance upon, the content or products found herein.