
|
CVS Health Corporation (CVS) Avaliação DCF |
Totalmente Editável: Adapte-Se Às Suas Necessidades No Excel Ou Planilhas
Design Profissional: Modelos Confiáveis E Padrão Da Indústria
Pré-Construídos Para Uso Rápido E Eficiente
Compatível com MAC/PC, totalmente desbloqueado
Não É Necessária Experiência; Fácil De Seguir
CVS Health Corporation (CVS) Bundle
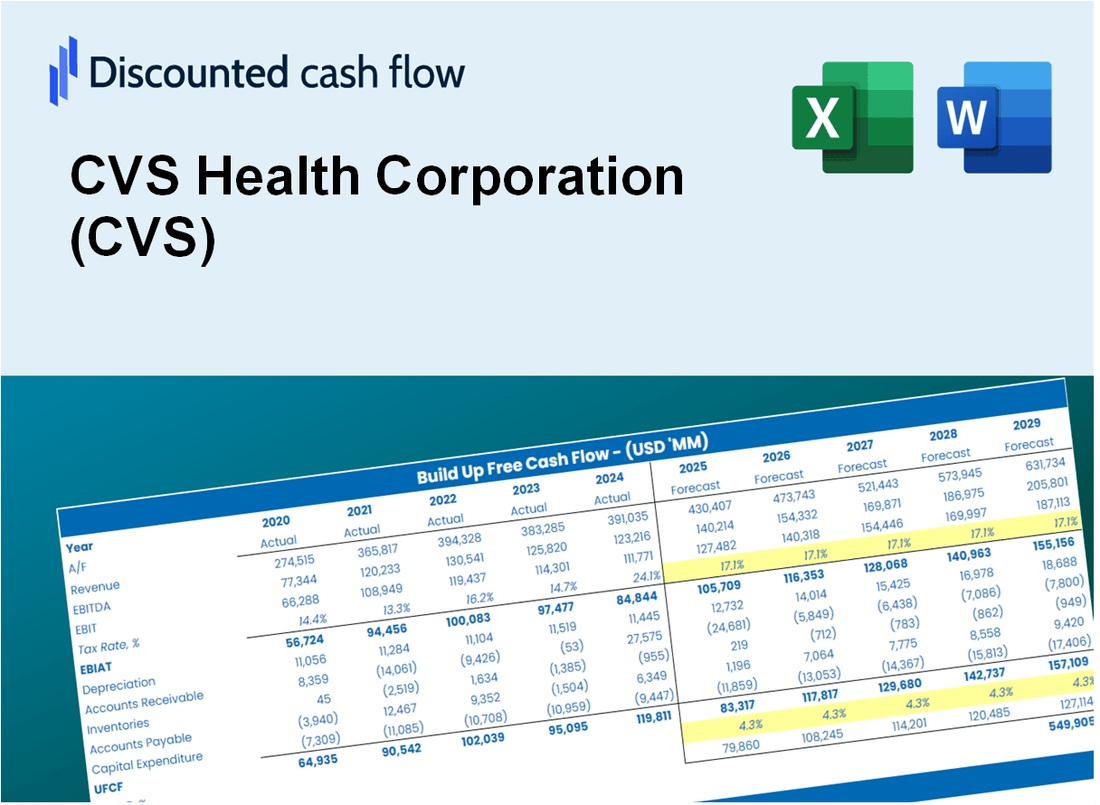
Explore o potencial financeiro da CVS Health Corporation (CVS) com nossa calculadora DCF amigável! Digite suas suposições de crescimento, margens e custos para calcular o valor intrínseco da CVS Health Corporation (CVS) e refinar sua abordagem de investimento.
What You Will Get
- Real CVS Financial Data: Pre-filled with CVS Health Corporation’s historical and projected data for precise analysis.
- Fully Editable Template: Modify key inputs like revenue growth, WACC, and EBITDA % with ease.
- Automatic Calculations: See CVS’s intrinsic value update instantly based on your changes.
- Professional Valuation Tool: Designed for investors, analysts, and consultants seeking accurate DCF results.
- User-Friendly Design: Simple structure and clear instructions for all experience levels.
Key Features
- Real-Life CVS Data: Pre-filled with CVS Health Corporation's historical financials and future projections.
- Fully Customizable Inputs: Modify revenue growth, profit margins, WACC, tax rates, and capital expenditures.
- Dynamic Valuation Model: Automatic updates to Net Present Value (NPV) and intrinsic value based on your adjustments.
- Scenario Testing: Develop multiple forecast scenarios to evaluate various valuation outcomes.
- User-Friendly Design: Intuitive, organized, and tailored for both professionals and novices.
How It Works
- Step 1: Download the Excel file.
- Step 2: Review CVS Health Corporation’s pre-filled financial data and forecasts.
- Step 3: Modify critical inputs like revenue growth, WACC, and tax rates (highlighted cells).
- Step 4: Watch the DCF model update instantly as you tweak assumptions.
- Step 5: Analyze the outputs and use the results for investment decisions.
Why Choose This Calculator for CVS Health Corporation (CVS)?
- Reliable Data: Access to accurate CVS financials ensures trustworthy valuation outcomes.
- Flexible Settings: Tailor essential variables such as growth rates, WACC, and tax rates to fit your forecasts.
- Efficiency Boost: Built-in calculations save you the hassle of starting from the ground up.
- Expert-Level Tool: Crafted for investors, analysts, and financial consultants.
- Easy to Use: User-friendly design and clear, step-by-step guidance cater to all experience levels.
Who Should Use CVS Health Corporation (CVS)?
- Investors: Gain insights into the healthcare market and make informed investment choices with CVS's comprehensive data.
- Healthcare Analysts: Utilize CVS's extensive resources to streamline research and analysis processes.
- Consultants: Easily tailor CVS's offerings for client engagements or strategic presentations.
- Health Enthusiasts: Enhance your knowledge of the pharmaceutical and retail health sectors through CVS's innovative solutions.
- Educators and Students: Leverage CVS as a case study for understanding healthcare management and business practices.
What the Template Contains
- Pre-Filled Data: Contains CVS Health Corporation's historical financials and projections.
- Discounted Cash Flow Model: An editable DCF valuation model with automated calculations.
- Weighted Average Cost of Capital (WACC): A dedicated sheet for calculating WACC using custom inputs.
- Key Financial Ratios: Evaluate CVS's profitability, efficiency, and leverage metrics.
- Customizable Inputs: Easily modify revenue growth, margins, and tax rates.
- Clear Dashboard: Visuals and tables summarizing essential valuation outcomes.
Disclaimer
All information, articles, and product details provided on this website are for general informational and educational purposes only. We do not claim any ownership over, nor do we intend to infringe upon, any trademarks, copyrights, logos, brand names, or other intellectual property mentioned or depicted on this site. Such intellectual property remains the property of its respective owners, and any references here are made solely for identification or informational purposes, without implying any affiliation, endorsement, or partnership.
We make no representations or warranties, express or implied, regarding the accuracy, completeness, or suitability of any content or products presented. Nothing on this website should be construed as legal, tax, investment, financial, medical, or other professional advice. In addition, no part of this site—including articles or product references—constitutes a solicitation, recommendation, endorsement, advertisement, or offer to buy or sell any securities, franchises, or other financial instruments, particularly in jurisdictions where such activity would be unlawful.
All content is of a general nature and may not address the specific circumstances of any individual or entity. It is not a substitute for professional advice or services. Any actions you take based on the information provided here are strictly at your own risk. You accept full responsibility for any decisions or outcomes arising from your use of this website and agree to release us from any liability in connection with your use of, or reliance upon, the content or products found herein.