
|
Dell Technologies Inc. (Dell): 5 forças Análise [Jan-2025 Atualizada] |
Totalmente Editável: Adapte-Se Às Suas Necessidades No Excel Ou Planilhas
Design Profissional: Modelos Confiáveis E Padrão Da Indústria
Pré-Construídos Para Uso Rápido E Eficiente
Compatível com MAC/PC, totalmente desbloqueado
Não É Necessária Experiência; Fácil De Seguir
Dell Technologies Inc. (DELL) Bundle
No cenário tecnológico em rápida evolução de 2024, a Dell Technologies Inc. navega em um complexo ecossistema de forças competitivas que moldam seu posicionamento estratégico e resiliência do mercado. Ao dissecar a estrutura das cinco forças de Michael Porter, revelamos a intrincada dinâmica das relações de fornecedores, poder do cliente, rivalidade de mercado, substitutos em potencial e barreiras de entrada que definem a estratégia competitiva da Dell. Esse mergulho profundo revela como a gigante da tecnologia mantém sua vantagem em um mercado tecnológico cada vez mais desafiador e transformador, equilibrando inovação, parcerias estratégicas e adaptabilidade de mercado para permanecer à frente dos desafios e oportunidades emergentes.
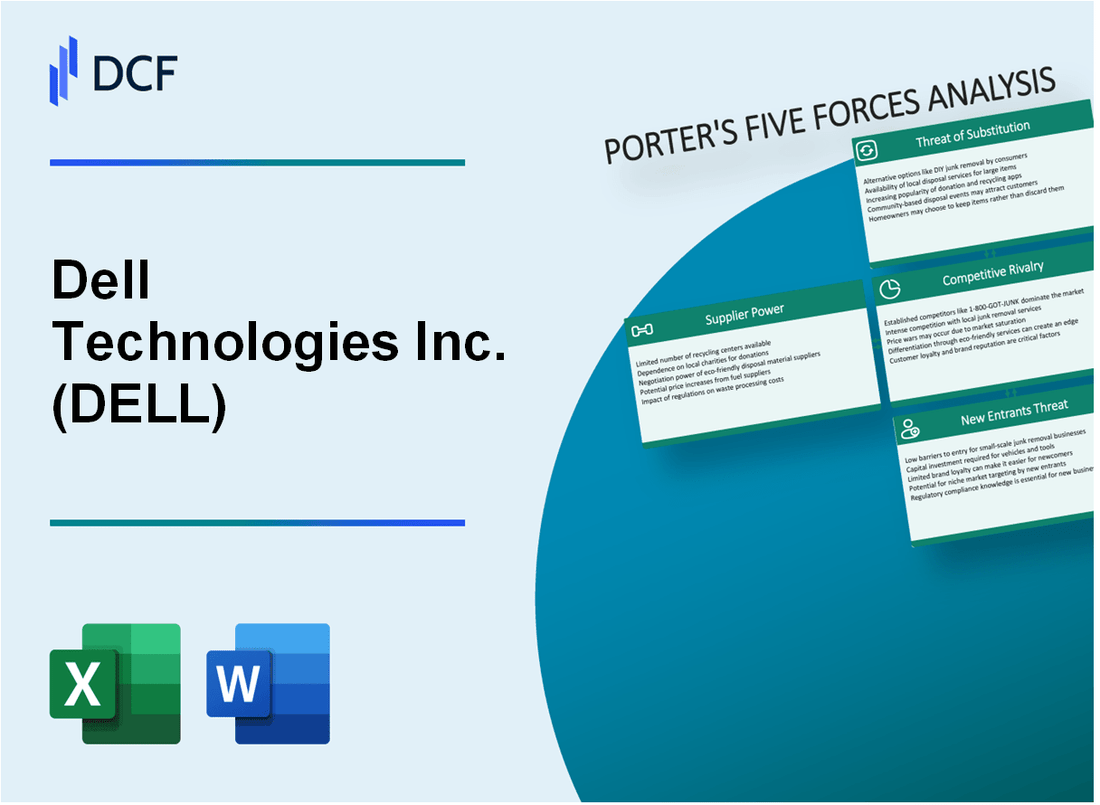
Dell Technologies Inc. (Dell) - As cinco forças de Porter: poder de barganha dos fornecedores
Fabricantes de componentes -chave
A partir do quarto trimestre 2023, a Dell conta com dois fabricantes primários de semicondutores:
| Fornecedor | Quota de mercado | Receita anual (2023) |
|---|---|---|
| Intel | 75.5% | US $ 54,2 bilhões |
| AMD | 24.5% | US $ 23,6 bilhões |
Dependência do fornecedor
Métricas de concentração de fornecedores de hardware da Dell para 2024:
- Controle dos 3 principais fornecedores 92,3% do fornecimento crítico de componentes
- Concentração da cadeia de suprimentos semicondutores: 86,7%
- Duração média do contrato de fornecedores: 3,4 anos
Parcerias de fornecedores estratégicos
| Fornecedor | Valor da parceria | Duração do contrato |
|---|---|---|
| Intel | US $ 4,7 bilhões | 5 anos |
| AMD | US $ 2,3 bilhões | 4 anos |
| TSMC | US $ 1,6 bilhão | 3 anos |
Indicadores de energia do fornecedor
Métricas de potência de barganha do fornecedor para Dell em 2024:
- Volatilidade do preço do componente: 14,2%
- Custos de troca de fornecedores: US $ 87 milhões
- Potencial de integração vertical: 22,5%
Dell Technologies Inc. (Dell) - As cinco forças de Porter: poder de barganha dos clientes
Segmentos de clientes e diversidade de mercado
A Dell atende a vários segmentos de clientes com características de compra distintas:
| Segmento de clientes | Porcentagem de receita | Valor médio de compra |
|---|---|---|
| Consumidores individuais | 28.4% | $1,247 |
| Pequenas/médias empresas | 35.6% | $3,892 |
| Grandes empresas | 36% | $127,500 |
Análise de sensibilidade ao preço
Métricas de sensibilidade ao preço do cliente:
- Tecnologia do consumidor Elasticidade do preço de mercado: 1.7
- Índice de Sensibilidade a Preços da Tecnologia da Enterprise: 0.9
- Expectativa média de desconto: 12,3%
Demandas de personalização do cliente
| Tipo de personalização | Porcentagem de demanda do cliente | Custo adicional médio |
|---|---|---|
| Configuração de hardware | 47.2% | $324 |
| Integração de software | 33.5% | $892 |
| Pacotes de serviço | 19.3% | $456 |
Impacto do canal de vendas direto
Desempenho on -line do canal de vendas diretas:
- Receita de vendas direta: US $ 61,4 bilhões
- Taxa de crescimento de vendas on -line: 16,7%
- Valor médio da transação: US $ 2.345
- Redução de custos por meio de vendas diretas: 22,3%
Dell Technologies Inc. (Dell) - As cinco forças de Porter: rivalidade competitiva
Cenário competitivo de mercado
A partir do quarto trimestre 2023, a Dell Technologies enfrenta intensa concorrência no mercado de soluções de computação e empresa pessoal com a seguinte dinâmica competitiva:
| Concorrente | Quota de mercado (%) | 2023 Receita ($ b) |
|---|---|---|
| HP Inc. | 25.4% | 52.3 |
| Lenovo | 22.7% | 47.8 |
| Dell Technologies | 18.9% | 102.3 |
| Maçã | 10.2% | 94.8 |
Métricas de inovação tecnológica
Investimento de P&D da Dell em inovação tecnológica competitiva:
- 2023 Gastos de P&D: US $ 4,6 bilhões
- Registros de patentes: 1.237 em 2023
- Novos lançamentos de produtos: 42 soluções corporativas
Dinâmica de participação de mercado
Flutuações de participação de mercado competitivas nos principais segmentos:
| Segmento | Participação de mercado da Dell | Mudança de ano a ano |
|---|---|---|
| Computação pessoal | 16.5% | -1.2% |
| Enterprise Solutions | 22.3% | +0.7% |
| Mercado de servidores | 19.8% | +0.4% |
Indicadores de pressão de preços
Preços de métricas competitivas:
- Redução média de preço do laptop: 5,3%
- Compressão do preço da solução corporativa: 3,7%
- Impacto da margem bruta: -1,2 pontos percentuais
Dell Technologies Inc. (Dell) - As cinco forças de Porter: ameaça de substitutos
Computação em nuvem crescente e alternativas de software como serviço
Tamanho do mercado global de computação em nuvem em 2023: US $ 569,32 bilhões. O mercado de software como serviço (SaaS) se projetou para atingir US $ 702,19 bilhões até 2030.
| Provedor de serviços em nuvem | Participação de mercado 2023 | Receita anual |
|---|---|---|
| Amazon Web Services | 32% | US $ 80,1 bilhões |
| Microsoft Azure | 23% | US $ 60,4 bilhões |
| Google Cloud | 10% | US $ 23,5 bilhões |
Aumentando o uso de dispositivos móveis e tablets
Remessas globais de smartphones em 2023: 1,17 bilhão de unidades. O mercado de tablets deve atingir US $ 93,89 bilhões até 2028.
- Penetração de smartphone em todo o mundo: 67,1%
- Taxa de crescimento do mercado de dispositivos móveis: 2,4% anualmente
- Vendas de tablets em 2023: 147,8 milhões de unidades
Crescente popularidade de aplicativos e serviços baseados na Web
Tamanho do mercado de aplicativos da Web em 2023: US $ 133,7 bilhões. Projetado para atingir US $ 260,38 bilhões até 2027.
| Categoria de aplicativo da web | Quota de mercado | Taxa de crescimento |
|---|---|---|
| Aplicativos de produtividade | 35% | 6.2% |
| Aplicativos de comunicação | 25% | 7.5% |
| Aplicativos de entretenimento | 20% | 5.8% |
Plataformas de computação alternativas emergentes
Valor de mercado da plataforma de computação alternativa em 2023: US $ 215,6 bilhões.
- Participação de mercado do Chromebook: 8,5%
- Vendas de Raspberry Pi: 64 milhões de unidades cumulativas
- Participação de mercado da Linux Desktop: 2,4%
Dell Technologies Inc. (Dell) - As cinco forças de Porter: ameaça de novos participantes
Altos requisitos de capital para infraestrutura de tecnologia
A Dell Technologies requer US $ 12,8 bilhões em despesas de capital a partir de 2023. O investimento em infraestrutura tecnológica cria barreiras de entrada substanciais para potenciais concorrentes.
| Categoria de requisito de capital | Valor do investimento (2023) |
|---|---|
| Infraestrutura do data center | US $ 5,6 bilhões |
| Pesquisar & Desenvolvimento | US $ 4,7 bilhões |
| Instalações de fabricação | US $ 2,5 bilhões |
Custos de pesquisa e desenvolvimento significativos
A Dell investiu US $ 4,7 bilhões em P&D durante o ano fiscal de 2023, representando 4,3% da receita total.
- Os gastos anuais de P&D impedem a entrada fácil do mercado
- A inovação tecnológica requer investimento contínuo
- Portfólio de patentes inclui mais de 18.000 patentes ativas
Reputação da marca estabelecida e economias de escala
A receita de 2023 da Dell atingiu US $ 102,3 bilhões, com participação de mercado global no segmento de PC em 16,8%.
| Segmento de mercado | Receita | Quota de mercado |
|---|---|---|
| Computação pessoal | US $ 52,9 bilhões | 16.8% |
| Soluções de infraestrutura | US $ 34,4 bilhões | 22.3% |
Experiência tecnológica complexa necessária para competir
A Dell emprega 133.000 profissionais globalmente com habilidades tecnológicas avançadas.
- Certificação técnica média dos funcionários: 3.7 Credenciais profissionais
- Força de trabalho de engenharia: 42.000 profissionais de tecnologia especializados
- Centros de Pesquisa Global: 12 grandes centros de inovação
Dell Technologies Inc. (DELL) - Porter's Five Forces: Competitive rivalry
The personal computer space remains a brutal fight for shelf space and customer preference. You see this clearly when you look at the global shipment numbers from the first quarter of 2025.
Dell Technologies holds the third spot, which is a tough place to be when the top two are so close and aggressive. Here is the breakdown of the global traditional PC market share based on shipments for Q1 2025, according to IDC:
| Vendor | Q1 2025 Market Share (%) | Q1 2025 Shipments (Millions of Units) |
| Lenovo | 24.1 | 15.2 |
| HP Inc. | 20.2 | 12.8 |
| Dell Technologies | 15.1 | 9.6 |
That gap between Dell and the number two spot is not wide, but Lenovo is pulling away at the top. Honestly, the pressure from both sides is constant.
In the server market, Dell Technologies maintains its lead, but the competition is closing in, especially with the AI buildout driving massive investment. For the overall server market in 2025, the shares look like this:
| Vendor | 2025 Market Share (%) |
| Dell Technologies | 19.3 |
| HPE | 13.0 |
| IBM | 3.2 |
HPE reported an astonishing 29% increase in server revenue in the first quarter of fiscal 2025, showing how fiercely they are contesting Dell's leadership. IBM, while holding a smaller 3.2% share, is focusing on high-end enterprise solutions.
The AI server segment is where the volume is highest, but the margins are under pressure. You have to watch the component costs, like memory chips, which have seen unprecedented price increases. Still, the sheer scale of demand means Dell is raising its outlook significantly.
- Dell Technologies' infrastructure unit (servers and networking) profit margin was reported at 12.4%.
- Dell's overall gross margin for the period was 21.1%.
- Dell projects it will ship $25 billion worth of AI servers by the end of fiscal 2026, up from a previous view of $20 billion.
- Dell recorded AI server orders of $12.3 billion in the third quarter of 2025.
- The AI server backlog stood at $18.4 billion at the end of the third quarter.
- Global spending on AI servers could surpass $200 billion per year by the end of the decade.
- Expected AI server gross margin for 2025 is the midteens percentage.
The hyperscalers-think AWS and Microsoft Azure-are not just customers; they are rivals in the infrastructure space, building out their own massive compute fabrics. This dynamic forces Dell to compete on scale and speed, even as they supply the very hardware these giants need.
Dell Technologies Inc. (DELL) - Porter's Five Forces: Threat of substitutes
You're looking at the competitive landscape for Dell Technologies Inc. (DELL) as we close out 2025, and the threat of substitutes is definitely a mixed bag. While the massive AI build-out is creating a huge, near-term demand pull for on-premise hardware, the underlying substitution pressures from cloud and alternative architectures haven't vanished.
Cloud Computing and Infrastructure Alternatives
Cloud computing, encompassing Software as a Service (SaaS) and Infrastructure as a Service (IaaS), remains a structural substitute for Dell's traditional on-premise Infrastructure Solutions Group (ISG) hardware sales. However, the current environment shows a strong counter-movement. Dell Technologies Inc. reported a record AI server backlog of $18.4 billion exiting the third quarter of fiscal year 2026. This backlog, built on $12.3 billion in AI server orders in Q3 alone, suggests that for the most demanding, cutting-edge workloads-specifically AI-enterprises are choosing to build out their own, dedicated, on-premise infrastructure rather than relying solely on public cloud providers right now. Still, the long-term shift toward OpEx models over CapEx spending for general IT infrastructure continues to pressure the traditional hardware refresh cycle.
The threat is also evolving within the data center itself. Hyper-converged Infrastructure (HCI) solutions are actively replacing older, siloed storage arrays. This substitution directly impacts Dell's storage revenue, which saw a 1% year-over-year decrease in Q3 FY26. HCI abstracts hardware resources, making it a software-defined alternative that appeals to the desire for cloud-like simplicity on-premises.
| Substitute Category | Market/Financial Metric (Late 2025 Data) | Relevant Dell Figure |
|---|---|---|
| Hyper-Converged Infrastructure (HCI) Market Size | USD 16.72 billion in 2025 | Storage revenue declined 1% Y/Y in Q3 FY26 |
| HCI Projected Growth | Projected to reach USD 37.63 billion by 2030 | ISG revenue grew 24% Y/Y in Q3 FY26 |
| AI Server Mitigation (Backlog) | $18.4 billion backlog as of Q3 FY26 end | FY26 AI server shipment target of roughly $25 billion |
Consumer Device Substitution and Software Alternatives
For the Client Solutions Group (CSG), mobile devices like smartphones and tablets continue to substitute for traditional consumer PCs for many daily tasks. While desktops still hold a slight edge in overall global web traffic share as of late 2025, the trend is clearly mobile-first in many regions. This dynamic puts pressure on the consumer PC segment, which saw its revenue decline by 7% in Q3 FY26.
Also, you can't ignore open-source software. It provides viable alternatives to the proprietary software stacks Dell bundles or sells alongside its hardware. This substitution threat is more about long-term platform lock-in and recurring revenue streams than immediate hardware replacement, but it's a constant factor in enterprise IT decisions.
- Global web traffic share (Oct 2024 - Oct 2025): Mobile at 48.99% vs. Desktop at 49.72%.
- North America web traffic share (Early 2025): Mobile accounted for 62% of internet time.
- Dell CSG Consumer Revenue: Declined 7% year-over-year in Q3 FY26.
- HCI adoption growth forecast for 2025: 30 percent annually.
- AI Server Orders in Q3 FY26: $12.3 billion.
The near-term mitigation, Dell Technologies Inc.'s $18.4 billion AI server backlog, is a powerful counter-force to substitution in the high-end server market, but the underlying erosion in consumer PCs and storage arrays persists. Finance: draft 13-week cash view by Friday.
Dell Technologies Inc. (DELL) - Porter's Five Forces: Threat of new entrants
The threat of new entrants for Dell Technologies Inc. remains relatively low, primarily due to the massive structural barriers built up over decades in the global PC and enterprise infrastructure markets. Starting a competing operation at scale requires capital and infrastructure that few organizations possess.
High capital expenditure is required to build a global supply chain and brand.
The sheer financial commitment needed to replicate Dell Technologies Inc.'s global footprint is immense. For context, Dell Technologies Inc.'s capital expenditures for Fiscal 2025 totaled approximately $2.7 billion, with the latest twelve months (TTM) figure standing at $2.617 billion. Building the necessary manufacturing capacity, securing component supply agreements, and establishing the logistics network to support this level of operation is a monumental hurdle. Furthermore, brand equity acts as a significant intangible barrier; as of March 2025, the Dell Technologies brand was valued at $7.5 billion. This established trust is not something a new entrant can purchase quickly.
Established distribution networks and channel partnerships create a strong barrier.
Dell Technologies Inc. leverages its deeply embedded sales channels and global reach, which new competitors struggle to match. Dell operates in over 180 countries, supported by an 'Unmatched Global Services footprint with team members and service centers supporting customers around the world'. This established network is a key differentiator against nimbler, niche players like Super Micro Computer (SMCI), as Dell's scale and service offerings provide an edge in securing large, complex enterprise and cloud contracts.
The competitive landscape in the high-growth AI server segment illustrates the scale difference:
| Metric | Dell Technologies Inc. (DELL) | Super Micro Computer (SMCI) |
|---|---|---|
| FY 2025 Revenue | Reported Q3 FY26 revenue of $27 billion | FY 2025 Revenue of $22 billion |
| FY 2026 AI Server Shipment Guidance | Expected to reach $25 billion | Projected FY2026 Revenue of $36 billion |
| AI Server Market Share (Estimate) | Implied significant share given scale | Approximately 23.0% share in the AI server market |
Niche players like Super Micro Computer (SMCI) are gaining traction in AI servers.
While the overall threat from a broad, full-line competitor is low, specialized players focused on the high-growth AI server market present an acute, segment-specific threat. The global AI server market is projected to reach $167.2 billion by the end of 2025. SMCI, for instance, achieved $22 billion in revenue in fiscal 2025 and holds an estimated 23.0% share of the AI server market. These niche players often prioritize speed-to-market with the latest components, which can temporarily bypass the slower, more standardized qualification processes of larger OEMs like Dell Technologies Inc.
Hyperscalers are vertically integrating, building custom AI hardware in-house.
The most significant long-term entrants are the hyperscalers themselves, who are increasingly designing and deploying custom silicon to reduce dependency on merchant silicon providers and optimize their infrastructure. This vertical integration is backed by staggering capital commitments:
- Microsoft committed $80 billion for fiscal 2025 AI data center investment.
- Alphabet committed $75 billion capex for 2025 AI infrastructure.
- Meta announced a $65 billion investment commitment for 2025.
- Amazon, Microsoft, and Google announced a combined $65 billion in new data center investments across North America and Europe.
This internal development is already yielding product: Amazon completed a large-scale deployment of 500,000 Trainium2 chips, and Microsoft's custom Athena processor has entered commercial testing. This move directly bypasses the need for traditional server vendors for their largest compute needs.
Significant brand loyalty and service contracts in the enterprise segment deter entry.
For the core enterprise customer base, switching costs are high, reinforced by long-term service agreements. Dell Technologies Inc. locks in customers through offerings like ProSupport Infrastructure Suite, which provides 'AI-driven adaptive insights and proactive, predictive, automated support'. These contracts often involve auto-renewal billing plans, ensuring recurring revenue streams and continued customer reliance on Dell's support ecosystem, which spans over 170 countries.
The commitment to ongoing support creates a sticky relationship:
- Dell offers service contract extensions with flexible billing options, allowing customers to 'lock in pricing for multi-year contracts'.
- The company provides Multivendor Support Service, simplifying operations by consolidating support for storage, servers, and networking from major manufacturers.
- Customers can purchase products without optional service contracts, but they cannot decline Dell's basic limited hardware warranty.
Finance: draft 13-week cash view by Friday.
Disclaimer
All information, articles, and product details provided on this website are for general informational and educational purposes only. We do not claim any ownership over, nor do we intend to infringe upon, any trademarks, copyrights, logos, brand names, or other intellectual property mentioned or depicted on this site. Such intellectual property remains the property of its respective owners, and any references here are made solely for identification or informational purposes, without implying any affiliation, endorsement, or partnership.
We make no representations or warranties, express or implied, regarding the accuracy, completeness, or suitability of any content or products presented. Nothing on this website should be construed as legal, tax, investment, financial, medical, or other professional advice. In addition, no part of this site—including articles or product references—constitutes a solicitation, recommendation, endorsement, advertisement, or offer to buy or sell any securities, franchises, or other financial instruments, particularly in jurisdictions where such activity would be unlawful.
All content is of a general nature and may not address the specific circumstances of any individual or entity. It is not a substitute for professional advice or services. Any actions you take based on the information provided here are strictly at your own risk. You accept full responsibility for any decisions or outcomes arising from your use of this website and agree to release us from any liability in connection with your use of, or reliance upon, the content or products found herein.