
|
Avaliação do Expedia Group, Inc. (Expe) |
Totalmente Editável: Adapte-Se Às Suas Necessidades No Excel Ou Planilhas
Design Profissional: Modelos Confiáveis E Padrão Da Indústria
Pré-Construídos Para Uso Rápido E Eficiente
Compatível com MAC/PC, totalmente desbloqueado
Não É Necessária Experiência; Fácil De Seguir
Expedia Group, Inc. (EXPE) Bundle
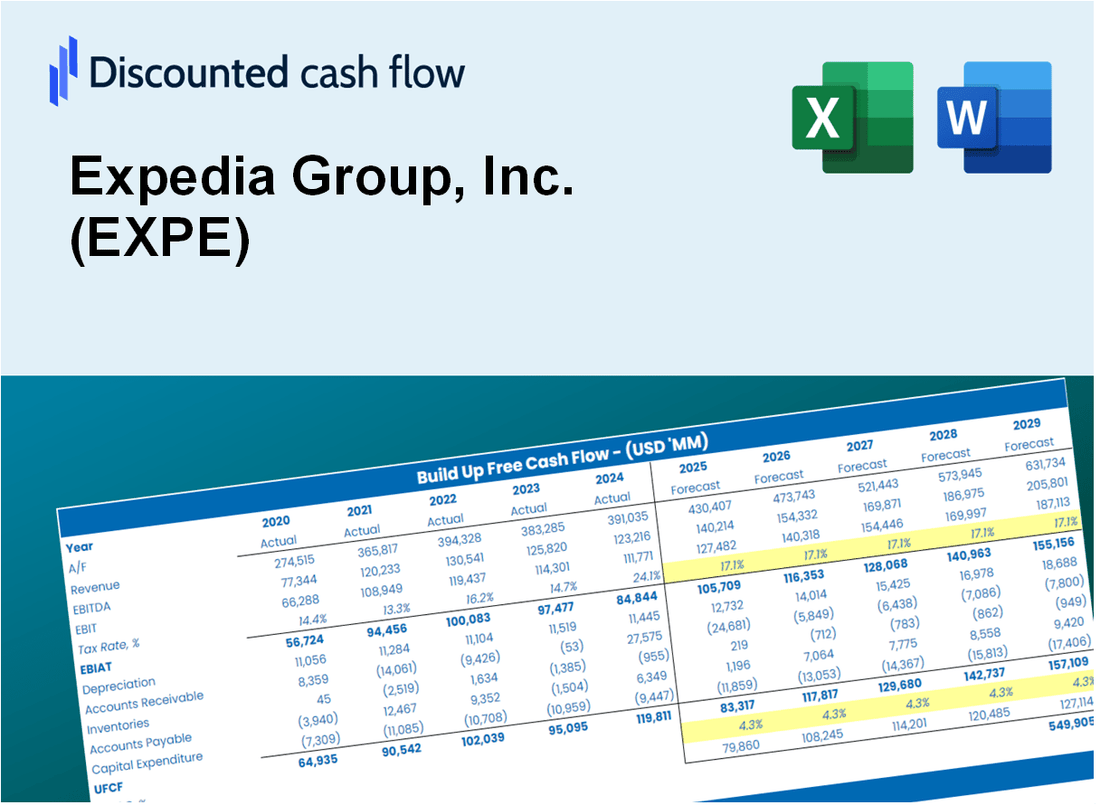
Ganhe domínio sobre o seu Expedia Group, Inc. (Expe) Análise de avaliação usando nossa sofisticada calculadora DCF! Este modelo do Excel é pré -carregado com dados de Expe precisos, permitindo ajustar as previsões e suposições para determinar o valor intrínseco da Expedia Group, Inc. com precisão.
What You Will Get
- Real EXPE Financials: Access to historical and projected data for precise valuation.
- Customizable Inputs: Adjust WACC, tax rates, revenue growth, and capital expenditures as needed.
- Dynamic Calculations: Intrinsic value and NPV are automatically computed.
- Scenario Analysis: Evaluate various scenarios to assess Expedia’s future performance.
- User-Friendly Design: Designed for professionals while remaining approachable for newcomers.
Key Features
- Comprehensive Data: Expedia Group’s historical financial statements and pre-filled projections.
- Customizable Inputs: Modify WACC, tax rates, revenue growth, and EBITDA margins to fit your analysis.
- Real-Time Insights: Watch Expedia Group’s intrinsic value update instantly as you adjust inputs.
- Intuitive Visualizations: Dashboard graphs showcase valuation results and essential metrics.
- Designed for Precision: A robust tool tailored for analysts, investors, and finance professionals.
How It Works
- Download the Template: Gain immediate access to the Excel-based EXPE DCF Calculator.
- Input Your Assumptions: Modify the yellow-highlighted cells for growth rates, WACC, margins, and more.
- Instant Calculations: The model automatically recalculates Expedia’s intrinsic value.
- Test Scenarios: Experiment with different assumptions to assess potential changes in valuation.
- Analyze and Decide: Utilize the results to inform your investment or financial analysis.
Why Choose This Calculator?
- Designed for Industry Experts: A sophisticated tool tailored for analysts, CFOs, and travel consultants.
- Comprehensive Data: Expedia Group's historical and projected financials are preloaded for precision.
- Flexible Scenario Analysis: Effortlessly simulate various forecasts and assumptions.
- Insightful Outputs: Automatically computes intrinsic value, NPV, and essential metrics.
- User-Friendly Interface: Step-by-step guidance ensures a smooth experience.
Who Should Use This Product?
- Travel Enthusiasts: Discover booking strategies and leverage real-time data for your trips.
- Researchers: Integrate travel industry models into your studies or academic papers.
- Investors: Validate your investment hypotheses and evaluate valuation metrics for Expedia Group, Inc. (EXPE).
- Market Analysts: Enhance your analysis with a customizable travel market model.
- Travel Agents: Understand how major travel companies like Expedia Group, Inc. (EXPE) operate and strategize.
What the Template Contains
- Preloaded EXPE Data: Historical and projected financial data, including revenue, EBIT, and capital expenditures.
- DCF and WACC Models: Professional-grade sheets for calculating intrinsic value and Weighted Average Cost of Capital.
- Editable Inputs: Yellow-highlighted cells for adjusting revenue growth, tax rates, and discount rates.
- Financial Statements: Comprehensive annual and quarterly financials for deeper analysis.
- Key Ratios: Profitability, leverage, and efficiency ratios to evaluate performance.
- Dashboard and Charts: Visual summaries of valuation outcomes and assumptions.
Disclaimer
All information, articles, and product details provided on this website are for general informational and educational purposes only. We do not claim any ownership over, nor do we intend to infringe upon, any trademarks, copyrights, logos, brand names, or other intellectual property mentioned or depicted on this site. Such intellectual property remains the property of its respective owners, and any references here are made solely for identification or informational purposes, without implying any affiliation, endorsement, or partnership.
We make no representations or warranties, express or implied, regarding the accuracy, completeness, or suitability of any content or products presented. Nothing on this website should be construed as legal, tax, investment, financial, medical, or other professional advice. In addition, no part of this site—including articles or product references—constitutes a solicitation, recommendation, endorsement, advertisement, or offer to buy or sell any securities, franchises, or other financial instruments, particularly in jurisdictions where such activity would be unlawful.
All content is of a general nature and may not address the specific circumstances of any individual or entity. It is not a substitute for professional advice or services. Any actions you take based on the information provided here are strictly at your own risk. You accept full responsibility for any decisions or outcomes arising from your use of this website and agree to release us from any liability in connection with your use of, or reliance upon, the content or products found herein.