
|
Fat Brands Inc. (FATBB): 5 forças Análise [Jan-2025 Atualizada] |
Totalmente Editável: Adapte-Se Às Suas Necessidades No Excel Ou Planilhas
Design Profissional: Modelos Confiáveis E Padrão Da Indústria
Pré-Construídos Para Uso Rápido E Eficiente
Compatível com MAC/PC, totalmente desbloqueado
Não É Necessária Experiência; Fácil De Seguir
FAT Brands Inc. (FATBB) Bundle
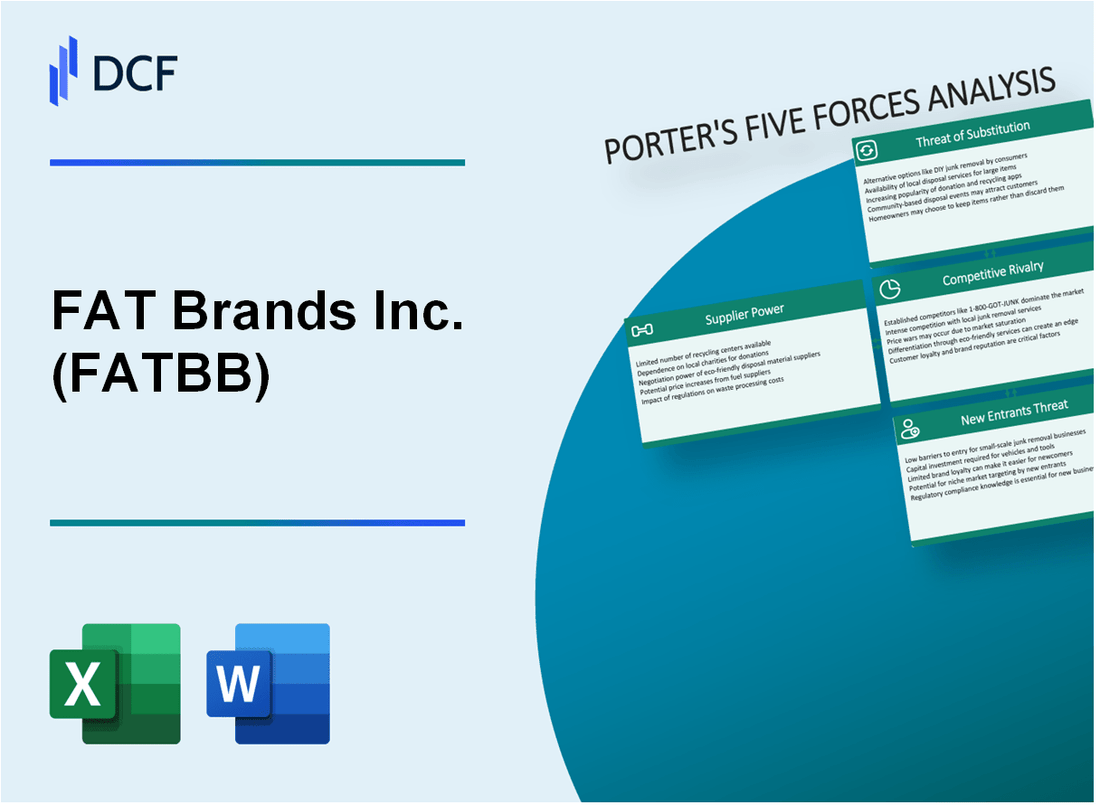
No mundo dinâmico de franquia de restaurantes, a Fat Brands Inc. navega em um cenário complexo de desafios competitivos e oportunidades estratégicas. Ao dissecar a estrutura das cinco forças de Michael Porter, revelamos a intrincada dinâmica que molda o posicionamento competitivo da empresa em 2024 - desde negociações de fornecedores e preferências de clientes até rivalidade de mercado e possíveis interrupções. Essa análise de mergulho profundo revela como as marcas de gordura manobra estrategicamente através de um ambiente de negócios multifacetado, equilibrando riscos e alavancando pontos fortes exclusivos em seu portfólio diversificado de conceitos de restaurantes.
Fat Brands Inc. (FATBB) - As cinco forças de Porter: poder de barganha dos fornecedores
Número limitado de ingredientes alimentares e fornecedores de equipamentos
A Fat Brands Inc. opera em 17 marcas de restaurantes com 2.400 locais no total em todo o mundo. A análise de concentração do fornecedor revela:
| Categoria de fornecedores | Concentração de mercado | Número de fornecedores primários |
|---|---|---|
| Ingredientes da carne | Alto | 3-4 grandes fornecedores nacionais |
| Equipamento de restaurante | Moderado | 5-6 fabricantes especializados |
| Ingredientes proprietários | Muito alto | 1-2 fornecedores exclusivos |
Altos custos de comutação
Custos de troca de equipamentos e ingredientes estimados em:
- Equipamento de cozinha de restaurante: US $ 75.000 - US $ 250.000 por local
- Reformulação de ingredientes proprietários: US $ 50.000 - US $ 150.000 por marca
- Reconfiguração da cadeia de suprimentos: 3-6 meses de tempo de implementação
Mercado de fornecedores concentrados
Concentração do mercado de fornecedores para marcas específicas:
| Marca | Fornecedores primários | Dependência do fornecedor |
|---|---|---|
| Fatburger | 2 fornecedores de carne | 87% de dependência da cadeia de suprimentos |
| Johnny Rockets | 3 fornecedores de ingredientes | 79% de dependência da cadeia de suprimentos |
Vulnerabilidades da cadeia de suprimentos
Fatores de risco da cadeia de suprimentos portfólio de várias marcos:
- Distribuição de fornecedores geográficos: 62% concentrados nos mercados norte -americanos
- Fornecedores de fonte única: 4 de 17 marcas
- Risco anual da cadeia de suprimentos: 18-22%
Fat Brands Inc. (FATBB) - As cinco forças de Porter: poder de barganha dos clientes
Consumidores sensíveis ao preço em segmentos de refeições rápidas e casuais
Em 2023, o preço médio da refeição do restaurante de serviço rápido foi de US $ 8,54, com os consumidores mostrando alta sensibilidade ao preço. Os conceitos de restaurantes da Fat Brands experimentaram uma elasticidade de preços de 3,2% em suas ofertas de menu.
| Conceito de restaurante | Preço médio da refeição | Índice de Sensibilidade ao Preço |
|---|---|---|
| Fatburger | $9.25 | 2.8 |
| Johnny Rockets | $10.50 | 3.1 |
| Hurricane Grill & Asas | $12.75 | 3.5 |
Aumentando a demanda do consumidor por diversas opções de menu
As preferências do consumidor por diversas opções de menu impactaram significativamente a estratégia das marcas de gordura.
- 68% dos consumidores buscam itens de menu personalizáveis
- 45% exigem alternativas de proteína baseada em plantas
- 52% preferem restaurantes com várias opções alimentares
Preferência crescente por plataformas de pedidos e entrega digitais
A receita de pedidos digitais para marcas de gordura aumentou 42% em 2023, com downloads de aplicativos móveis atingindo 1,2 milhão em todos os conceitos de restaurantes.
| Plataforma digital | Volume do pedido | Contribuição da receita |
|---|---|---|
| Aplicativo móvel | 3,5 milhões de pedidos | US $ 47,3 milhões |
| Entrega de terceiros | 2,8 milhões de pedidos | US $ 38,6 milhões |
Altas expectativas do cliente por qualidade consistente
Pontuações de satisfação do cliente nos conceitos de restaurantes de marcas gordas:
- Fatburger: 4.2/5 Classificação de clientes
- Johnny Rockets: 4.1/5 Classificação de clientes
- Hurricane Grill & Asas: 4,3/5 Classificação do cliente
Taxa de retenção de clientes entre as marcas: 62,5% em 2023
Fat Brands Inc. (FATBB) - As cinco forças de Porter: rivalidade competitiva
Concorrência intensa no mercado de franquias de restaurantes de várias marcas
A partir do quarto trimestre 2023, o mercado de restaurantes de serviço rápido (QSR) demonstrou intensidade competitiva significativa com as seguintes métricas-chave:
| Concorrente | Quota de mercado | Receita anual |
|---|---|---|
| Yum! Marcas | 15.3% | US $ 6,8 bilhões |
| Restaurant Brands International | 12.7% | US $ 5,4 bilhões |
| Fat Brands Inc. | 4.2% | US $ 1,3 bilhão |
Análise de grandes concorrentes
Principais características da paisagem competitiva:
- Número de principais concorrentes do QSR: 8
- Avaliação total do mercado: US $ 87,6 bilhões
- Taxa média de crescimento anual da franquia de restaurantes: 3,5%
Dinâmica de fragmentação do mercado
Detalhes de fragmentação da indústria de restaurantes de serviço rápido:
- Número total de marcas QSR: 127
- 5 principais marcas Concentração do mercado: 42,6%
- Marcas de franquia independentes: 73
Métricas de diferenciação da marca
| Métrica de inovação da marca | Valor |
|---|---|
| Investimentos anuais de inovação de menu | US $ 42 milhões |
| Frequência de lançamento de novos produtos | 4,7 vezes por ano |
| Porcentagem média de gastos de P&D | 2,3% da receita |
Fat Brands Inc. (FATBB) - As cinco forças de Porter: ameaça de substitutos
Crescente popularidade dos serviços de entrega de refeições
Doordash registrou US $ 6,58 bilhões em receita total em 2022. O Uber Eats gerou US $ 2,9 bilhões em receita no quarto trimestre 2023. Essas plataformas processaram 2,4 bilhões de ordens em 2022, representando um aumento de 14% ano a ano.
| Plataforma de entrega de refeições | 2023 participação de mercado | Receita anual |
|---|---|---|
| Doordash | 59% | US $ 7,2 bilhões |
| Uber come | 22% | US $ 3,4 bilhões |
| GRUBHUB | 12% | US $ 1,8 bilhão |
Crescente interesse do consumidor em alternativas de alimentos mais saudáveis
O mercado global de alimentos saudáveis foi avaliado em US $ 372,3 bilhões em 2022, projetado para atingir US $ 480,3 bilhões até 2027.
- 75% dos consumidores relatam que buscam opções de restaurantes mais saudáveis
- O mercado de alimentos à base de plantas cresceu 6,2% em 2022
- O mercado alternativo de proteínas deve atingir US $ 85,6 bilhões até 2030
Aumentando as tendências de cozimento doméstico pós-pandêmica
54% dos americanos relataram cozinhar mais refeições em casa em 2023. Os serviços de entrega de supermercados atingiram US $ 32,1 bilhões em receita em 2022.
| Serviço de entrega de supermercado | 2023 Receita de mercado |
|---|---|
| Instacart | US $ 2,5 bilhões |
| Amazon fresco | US $ 1,8 bilhão |
Surgimento de opções de refeições à base de plantas e alternativas
O mercado global de alimentos baseado em vegetais foi avaliado em US $ 42,86 bilhões em 2022, com um CAGR projetado de 12,95% de 2023 a 2030.
- Beyond Meat reportou receita de US $ 464,7 milhões em 2022
- Alimentos impossíveis avaliados em US $ 7 bilhões em 2022
- As ofertas de menu de restaurantes baseadas em plantas aumentaram 68% entre 2020-2023
Fat Brands Inc. (FATBB) - As cinco forças de Porter: ameaça de novos participantes
Altos requisitos de capital inicial para franquia de restaurantes
FAT Brands Franchising Os custos de startup variam de US $ 250.000 a US $ 1.500.000, dependendo do conceito específico do restaurante. As taxas de franquia normalmente variam entre US $ 35.000 a US $ 75.000 por localização do restaurante.
| Categoria de franquia | Intervalo de investimento inicial | Taxa de franquia |
|---|---|---|
| Fatburger | $350,000 - $750,000 | $50,000 |
| Hurricane Grill & Asas | $500,000 - $1,200,000 | $45,000 |
| Johnny Rockets | $400,000 - $900,000 | $35,000 |
Ambiente regulatório complexo
A conformidade regulatória da indústria de restaurantes envolve várias camadas de requisitos:
- Regulamentos do Departamento de Saúde
- Certificação de segurança alimentar Custos: US $ 100 - US $ 500 por funcionário
- Taxas de licenciamento de negócios específicos do estado: $ 50 - $ 500
- Processamento de número de identificação do empregador federal
Reconhecimento de marca estabelecida
O portfólio de marcas de gordura inclui 8 marcas de restaurantes com presença acumulada no mercado de mais de 2.100 locais globalmente a partir de 2023.
| Marca | Locais totais | Presença global |
|---|---|---|
| Fatburger | 350 | Estados Unidos, Canadá, Oriente Médio |
| Hurricane Grill & Asas | 250 | Principalmente Estados Unidos |
| Johnny Rockets | 300 | Mercados internacionais |
Sistemas sofisticados de gerenciamento de franquias
Investimento de infraestrutura de tecnologia da Fat Brands: US $ 5,2 milhões em 2022 para plataformas de gerenciamento de franquias.
- Sistemas de ponto de venda centralizados
- Gerenciamento de inventário em tempo real
- Plataformas de treinamento digital
- Redes de suporte de franquia abrangentes
FAT Brands Inc. (FATBB) - Porter's Five Forces: Competitive rivalry
You're looking at the competitive rivalry section, and honestly, the landscape for FAT Brands Inc. is a pressure cooker. This isn't a niche market; you are fighting across the Quick Service Restaurant (QSR), fast-casual, and casual dining segments simultaneously. That means the sheer number of established players, from massive global entities to nimble local concepts, keeps the pressure on unit-level economics every single day.
The market share battle is evident in the top-line results. For the third quarter of 2025, system-wide sales for FAT Brands Inc. were down 5.5%, hitting \$567.5 million compared to the prior year period's \$600.7 million. This overall contraction, coupled with a portfolio-wide same-store sales (SSS) decline of 3.5% in Q3 2025, signals that consumers are either trading down, spending less, or choosing rivals. To be fair, that 3.5% decline was an improvement, narrowing from the 4.2% drop seen in the second quarter of 2025. Still, the pressure is real.
The financial strain from this rivalry directly impacts pricing power. When you look at the bottom line for Q3 2025, FAT Brands Inc. reported a GAAP net loss of \$58.2 million on total revenue of \$140.0 million. Furthermore, the GAAP EBITDA for the quarter turned negative at -\$7.7 million. Honestly, posting significant losses like this makes it incredibly difficult to engage in price wars or offer deep promotional discounts against competitors with stronger balance sheets.
Still, FAT Brands Inc. is actively pushing strategies to counteract this rivalry intensity. A key focus is co-branding, which aims to capture more consumer occasions under one roof and boost unit-level sales. For instance, the success of the Round Table Pizza-Fatburger dual location is cited as having more than doubled weekly sales. The company also launched a Round Table Pizza and Marble Slab Creamery pairing in Q1 2025. These efforts are critical for driving incremental revenue where the overall market is contracting.
The competitive set is formidable. While the prompt mentions giants like Yum! Brands and Restaurant Brands International, the data shows direct competition across FAT Brands Inc.'s portfolio of 18 restaurant concepts. The company, which franchises approximately 2,300 units globally, is competing against players like Buffalo Wild Wings (a Private Equity-Backed company), and other publicly traded peers like Texas Roadhouse, Inc. and Red Robin Gourmet Burgers, Inc.. The company's market capitalization as of November 7, 2025, was only \$26.9M, which puts it at a significant scale disadvantage against these established rivals.
Here's a quick look at how FAT Brands Inc.'s recent performance metrics reflect the competitive environment:
| Metric | FAT Brands Inc. Q3 2025 Result | Context/Comparison |
|---|---|---|
| Total Revenue | \$140.0 million | Down 2.3% Year-over-Year (YoY) |
| GAAP Net Loss | \$58.2 million | Wider than the \$44.8 million loss in Q3 2024 |
| GAAP EBITDA | -\$7.7 million | Turned negative from a positive \$1.7 million in Q3 2024 |
| Portfolio SSS Change | -3.5% | Narrowed from -4.2% in Q2 2025 |
| Casual Dining SSS Change | +3.9% | A bright spot amidst overall decline |
| New Units Opened YTD (Q3) | 60 | Target reduced to 80 for 2025 from an initial 100 |
The rivalry forces strategic actions, such as the push for co-branding and the continued, albeit slowed, expansion. The company opened 13 new locations in Q3 2025, bringing the year-to-date total to 60. However, the initial 2025 new store target was reduced from over 100 to 80 new openings, partly due to franchisee delays, which itself is a sign of operational friction in a tough market.
The competitive intensity is further illustrated by the need for internal optimization and external capital:
- Securing a bondholder agreement to convert amortizing bonds to interest-only, saving \$30 to \$40 million annually in cash flow.
- Implementing over \$5 million in annual General & Administrative (G&A) reductions.
- General and Administrative expenses increased to \$42.7 million in Q3 2025 from \$34.5 million in the prior year quarter.
- Plans for a \$75 million to \$100 million equity raise at Twin Hospitality Group to pay down debt.
- The stock price as of November 7, 2025, was \$1.45.
The casual dining segment shows some resilience, with a 3.9% increase in same-store sales for that specific group. Still, the overall portfolio is fighting for every dollar, evidenced by the -3.5% SSS decline across all brands in the latest reported quarter.
FAT Brands Inc. (FATBB) - Porter's Five Forces: Threat of substitutes
You're looking at the competitive landscape for FAT Brands Inc. (FATBB) as of late 2025, and the threat of substitutes is definitely a major pressure point. When consumers have many options for a meal that isn't one of your 18 diverse concepts, your pricing and value proposition come under intense scrutiny. Honestly, the sheer volume of alternatives available right now is staggering.
The digital convenience layer has become a massive substitute, driven by third-party aggregators. The US online food delivery market is projected to hit $429.90 billion in revenue in 2025. Within that, DoorDash commands a 67% market share, while Uber Eats holds 23%. These platforms offer a seamless way for customers to bypass your brick-and-mortar locations entirely, substituting a Fatburger or a Round Table Pizza order with a competitor's offering delivered to their door.
We also see substitution pressure from the at-home meal preparation sector, which is evolving rapidly. While the Meal Kit Delivery Services industry in the US is estimated to generate $9.1 billion in revenue in 2025, this figure reflects a slowdown as consumers increasingly pivot to other convenient options.
Here's a quick look at the scale of these substitute markets compared to FAT Brands' recent top-line performance:
| Market Segment | 2025 Estimated Value/Metric | Relevance to FAT Brands Inc. |
|---|---|---|
| US Online Food Delivery Market Size | $429.90 billion | Direct digital substitution channel |
| DoorDash Market Share (US) | 67% | Dominant third-party delivery platform |
| Global Plant-Based Food Market Size | $56.37 billion | Growing health-conscious alternative |
| US Plant-Based Food Market CAGR (2025-2032) | 12.53% | Indicates strong, sustained growth in alternatives |
| FAT Brands Inc. Q3 2025 Total Revenue | $140.0 million | Benchmark for comparison |
| FAT Brands Inc. Q3 2025 Same-Store Sales (SSS) Change | -3.5% | Reflects consumer choice shifting away from FAT Brands |
The health and wellness trend is another significant force pulling consumer dollars. The global plant-based food market is valued at $56.37 billion in 2025, with North America driving much of that growth. The US segment is projected to grow at a Compound Annual Growth Rate (CAGR) of 12.53% through 2032. This means more non-meat, non-traditional options are entering the consideration set for customers looking for lunch or dinner.
Furthermore, the sheer variety within FAT Brands Inc. itself is somewhat neutralized by the ease of switching to substitutes. You manage 18 distinct restaurant concepts, operating approximately 2,300 locations globally. However, a customer can just as easily switch from considering a Fatburger to ordering a prepared meal from a grocery store deli, which often presents a cheaper alternative when household budgets are tight.
Economic pressures are definitely amplifying this threat. You saw this play out in the Q3 2025 results, where system-wide sales dropped 5.5% and the net loss widened to $58.2 million. When consumers feel the pinch-and the $3.39 per diluted share loss in Q3 2025 suggests they are-they trade down. This environment makes cheaper, more accessible substitutes, like value-focused grocery prepared meals or even fast-food value menus outside the FAT Brands portfolio, much more appealing.
The substitution risk is high because:
- Digital delivery platforms capture a massive share of the convenience spend.
- Plant-based and health-focused options are growing at a double-digit CAGR.
- Grocery and convenience store prepared foods offer a lower-cost, immediate alternative.
- FAT Brands Inc.'s own Q3 2025 SSS decline of 3.5% signals customers are actively choosing substitutes.
If onboarding takes 14+ days, churn risk rises, and in this environment, customers are definitely looking for immediate value elsewhere.
FAT Brands Inc. (FATBB) - Porter's Five Forces: Threat of new entrants
You're assessing the barriers to entry in the multi-brand restaurant franchising space, and honestly, it's not a wide-open door for just anyone. For FAT Brands Inc., the threat of new entrants is generally low-to-moderate, primarily because starting a comparable platform requires serious capital outlay. Launching a single concept is one thing; building a multi-brand platform across 18 concepts, as FAT Brands Inc. currently does, demands significant upfront investment in technology, legal infrastructure, and initial corporate overhead. This high capital requirement acts as a solid initial moat.
The established brand recognition across FAT Brands Inc.'s portfolio creates a significant hurdle. New entrants don't just need a good burger or pizza concept; they need instant consumer trust. FAT Brands Inc. has a portfolio that includes concepts with decades of history, like Fatburger, founded in 1947, and Johnny Rockets, founded in 1986. A new player has to spend heavily just to get to parity in consumer awareness, let alone surpass it. This is especially true when you consider the scale they've already achieved.
Scale is where FAT Brands Inc. signals its defensive strength. They aren't just maintaining; they are aggressively expanding. The company has a robust development pipeline of approximately 900 committed new locations, which management expects will contribute $50-$60 million in incremental Adjusted EBITDA once fully ramped. Furthermore, they opened 60 new restaurants year-to-date in Q3 2025, keeping them on track for a goal of over 100 new openings for the full year. This pipeline signals deep franchisee confidence and operational momentum that new entrants would struggle to match quickly.
New concepts definitely face friction when trying to secure the best real estate. Prime locations near high-traffic areas are often locked up by established operators like FAT Brands Inc. Also, building a resilient global supply chain-one that can service ~2,300 units worldwide across diverse concepts-is a massive undertaking. A new entrant would have to negotiate national distribution agreements from a position of very low volume, leading to higher initial procurement costs and less favorable terms than what an established player commands.
However, you can't ignore the structural vulnerability inherent in the model itself. The asset-light franchising model, which FAT Brands Inc. is actively pursuing with the planned refranchising of 57 company-operated Fazoli's restaurants, is designed for rapid scalability, but that scalability can be turned against them. Well-funded private equity firms, which have deep pockets for acquisition and rapid rollout, can potentially replicate the structure-acquiring smaller chains or developing a new concept and aggressively franchising it using similar legal and operational templates. The speed at which FAT Brands Inc. itself has grown through acquisition is the blueprint for replication.
Here's a quick look at the scale metrics that define the current barrier:
| Metric | FAT Brands Inc. (Late 2025 Estimate) | New Entrant Challenge |
| Number of Restaurant Concepts Owned | 18 | Need to build/acquire a diverse portfolio |
| Total Units Open Worldwide | Approximately 2,300 | Requires massive initial capital for physical footprint |
| Committed New Unit Pipeline | Approximately 900 agreements | Indicates multi-year growth visibility |
| Expected Incremental EBITDA from Pipeline | $50-$60 million | Represents significant future earnings potential |
| Q3 2025 Total Revenue | $140.0 million | Scale of current operations |
The company's focus on co-branding, like the Round Table Pizza and Fatburger dual location that more than doubled weekly sales, shows an innovation lever that new entrants must also master to compete effectively.
Disclaimer
All information, articles, and product details provided on this website are for general informational and educational purposes only. We do not claim any ownership over, nor do we intend to infringe upon, any trademarks, copyrights, logos, brand names, or other intellectual property mentioned or depicted on this site. Such intellectual property remains the property of its respective owners, and any references here are made solely for identification or informational purposes, without implying any affiliation, endorsement, or partnership.
We make no representations or warranties, express or implied, regarding the accuracy, completeness, or suitability of any content or products presented. Nothing on this website should be construed as legal, tax, investment, financial, medical, or other professional advice. In addition, no part of this site—including articles or product references—constitutes a solicitation, recommendation, endorsement, advertisement, or offer to buy or sell any securities, franchises, or other financial instruments, particularly in jurisdictions where such activity would be unlawful.
All content is of a general nature and may not address the specific circumstances of any individual or entity. It is not a substitute for professional advice or services. Any actions you take based on the information provided here are strictly at your own risk. You accept full responsibility for any decisions or outcomes arising from your use of this website and agree to release us from any liability in connection with your use of, or reliance upon, the content or products found herein.