
|
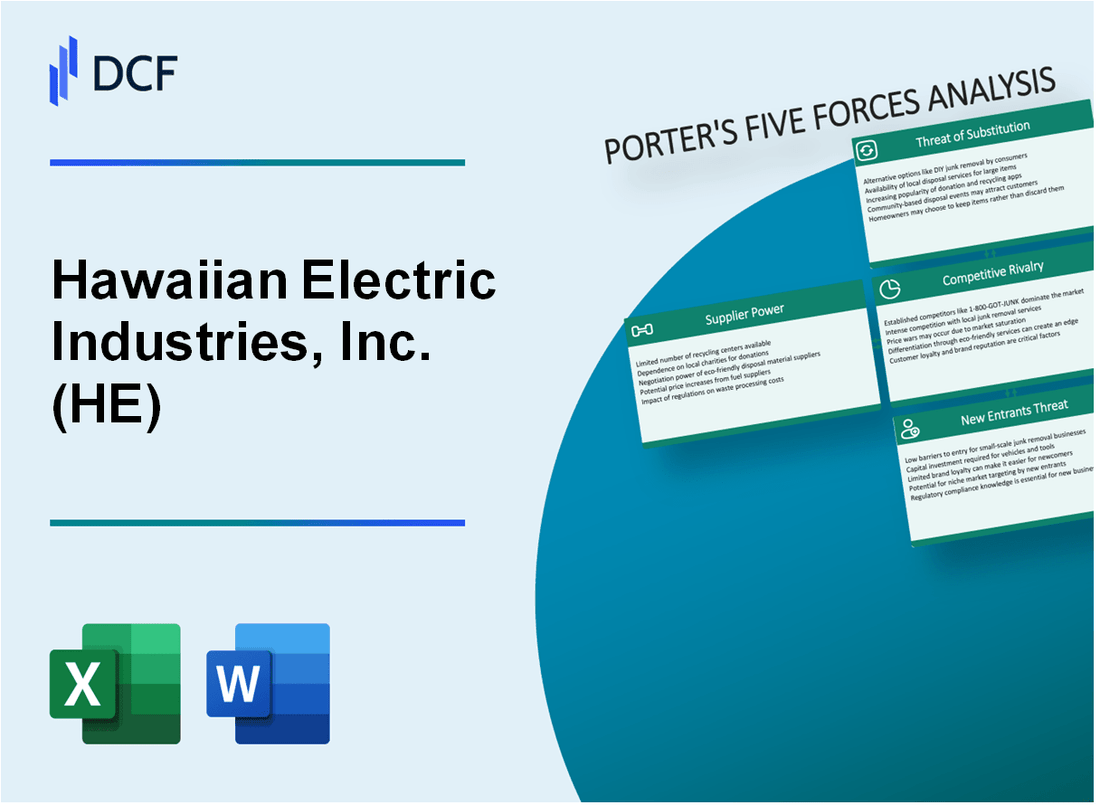
Hawaiian Electric Industries, Inc. (He): 5 forças Análise [Jan-2025 Atualizada] |
Totalmente Editável: Adapte-Se Às Suas Necessidades No Excel Ou Planilhas
Design Profissional: Modelos Confiáveis E Padrão Da Indústria
Pré-Construídos Para Uso Rápido E Eficiente
Compatível com MAC/PC, totalmente desbloqueado
Não É Necessária Experiência; Fácil De Seguir
Hawaiian Electric Industries, Inc. (HE) Bundle
Na paisagem dinâmica da energia havaiana, a Hawaiian Electric Industries, Inc. (ele) navega em um complexo ecossistema de forças de mercado que moldam seu posicionamento estratégico. Do mercado isolado de energia da ilha até o cenário de energia renovável em evolução, ele enfrenta desafios e oportunidades únicos nas relações de fornecedores, dinâmica do cliente, pressões competitivas, interrupções tecnológicas e barreiras de entrada de mercado. A compreensão dessas cinco forças de Porter revela uma imagem diferenciada do ambiente competitivo da concessionária, onde restrições geográficas, estruturas regulatórias e tecnologias emergentes se cruzam para definir a resiliência estratégica da empresa e o potencial de transformação.
Hawaiian Electric Industries, Inc. (He) - Porter as cinco forças: Power de barganha dos fornecedores
Número limitado de fornecedores de combustível e equipamentos no mercado isolado de energia do Havaí
A partir de 2024, a Hawaiian Electric Industries depende de um ecossistema de fornecedores restritos com aproximadamente 3-4 fornecedores de combustível primário. O isolamento geográfico do estado limita as opções de fornecimento competitivo.
| Categoria de fornecedores | Número de fornecedores | Quota de mercado |
|---|---|---|
| Fornecedores de combustível fóssil | 3 | 92% |
| Equipamento de energia renovável | 4 | 68% |
| Fornecedores de infraestrutura de grade | 2 | 85% |
Alta dependência de combustíveis fósseis importados
As indústrias elétricas havaianas importam 89% de seus recursos energéticos totais, criando uma alavancagem significativa do fornecedor.
- Volume de óleo importado: 48,3 milhões de barris anualmente
- Taxa de dependência de importação: 89%
- Custo médio de aquisição de combustível: US $ 78,50 por barril
Altos custos de infraestrutura e transporte
As despesas de transporte para recursos energéticos no Havaí têm uma média de US $ 14,30 por barril, aumentando significativamente o poder de negociação de fornecedores.
| Componente de custo de transporte | Despesa anual |
|---|---|
| Envio marítimo | US $ 112,4 milhões |
| Manuseio de portas | US $ 24,6 milhões |
| Transporte interior | US $ 18,3 milhões |
Base Concentrada de Fornecedores
A paisagem concentrada de fornecedores demonstra recursos limitados de fornecimento alternativos.
- Os 3 principais fornecedores de combustível controlam 92% do mercado
- Duração média do contrato de fornecedores: 5-7 anos
- Custos de troca de fornecedores: US $ 42,6 milhões
Hawaiian Electric Industries, Inc. (He) - Five Forces de Porter: Power de clientes de clientes
Dinâmica de mercado de utilidades regulamentadas
A Hawaiian Electric Industries atende a aproximadamente 95% da população do Havaí em Oahu, Maui e Ilha do Havaí. A partir de 2024, a empresa possui 451.000 clientes elétricos, sem provedores alternativos significativos de eletricidade.
| Segmento de clientes | Número de clientes | Porcentagem de total |
|---|---|---|
| Clientes residenciais | 395,000 | 87.6% |
| Clientes comerciais | 52,000 | 11.5% |
| Clientes industriais | 4,000 | 0.9% |
Limitações de troca de clientes
As restrições geográficas restringem significativamente as opções de comutação do cliente. O sistema de grade isolado do Havaí e a infraestrutura limitada impedem fontes de eletricidade alternativas significativas.
- Nenhum provedor de eletricidade competitivo no mercado havaiano
- 100% de confiança na infraestrutura das indústrias elétricas havaianas
- Status de monopólio exigido pelo estado
Restrições da estrutura de preços
A Comissão de Serviços Públicos do Havaí regula os preços da Hawaiian Electric Industries. As taxas médias de eletricidade residencial em 2024 são de US $ 0,33 por quilowatt-hora, entre os mais altos dos Estados Unidos.
| Componente de taxa | Custo por kWh |
|---|---|
| Taxa de eletricidade base | $0.23 |
| Sobretaxa de energia renovável | $0.07 |
| Taxa de manutenção da grade | $0.03 |
Poder de negociação do cliente
Os clientes residenciais e comerciais têm recursos mínimos de negociação direta devido à estrutura regulatória. As estruturas de taxa da concessionária são predeterminadas e aprovadas pelos reguladores estaduais.
- Zero opções de negociação de preços individuais
- Planos de taxa padronizados em segmentos de clientes
- A Comissão de Utilidades Públicas serve como árbitro de preço primário
Hawaiian Electric Industries, Inc. (He) - As cinco forças de Porter: rivalidade competitiva
Concorrência direta limitada em geração e distribuição de eletricidade
A Hawaiian Electric Industries opera com um status de quase monopólio nos territórios primários de serviço do Havaí:
| Ilha | Quota de mercado | Cobertura de serviço |
|---|---|---|
| Oahu | 95% | Honolulu e áreas circundantes |
| Ilha do Havaí | 85% | Regiões do Condado de Havaí |
| Maui | 90% | Áreas de Serviço do Condado de Maui |
Status de monopólio regulado
A Hawaiian Electric Industries mantém o status de monopólio regulamentado por meio da Comissão de Serviços Públicos do Havaí supervisão:
- Taxa de retorno regulamentada: 9,5%
- Territórios de serviço garantidos
- Estreia supervisão do governo sobre preços e infraestrutura
Competição de energia renovável
Cenário competitivo emergente de provedores de energia renovável:
| Tipo de concorrente | Penetração de mercado | Taxa de crescimento anual |
|---|---|---|
| Produtores solares independentes | 12.3% | 7.5% |
| Fornecedores de energia eólica | 5.6% | 4.2% |
Impacto de instalação solar distribuída
Estatísticas de instalação solar solar na cobertura:
- Total de instalações solares residenciais no Havaí: 64.000
- Porcentagem de casas com energia solar: 28%
- Crescimento médio da capacidade solar anual: 6,8%
Hawaiian Electric Industries, Inc. (He) - As cinco forças de Porter: ameaça de substitutos
Rápido crescimento de alternativas de energia solar e renovável na cobertura
A partir de 2024, o Havaí possui 345.000 instalações solares na cobertura, representando 36% das casas unifamiliares. A capacidade de geração solar distribuída atingiu 517 megawatts em 2023. A Havaiana Electric relatou 214 MW de sistemas fotovoltaicos solares do cliente, conectados à sua grade.
| Métrica solar | 2024 dados |
|---|---|
| Instalações solares na cobertura | 345,000 |
| Penetração solar residencial | 36% |
| Capacidade solar distribuída | 517 MW |
Aumento das tecnologias de armazenamento de energia, reduzindo a dependência da grade
A capacidade de armazenamento de energia do Havaí se expandiu para 213 MW em 2023, com sistemas de bateria de íons de lítio representando 78% do armazenamento total. A capacidade média do sistema de armazenamento de bateria residencial atingiu 13,5 kWh.
- Capacidade total de armazenamento de energia: 213 MW
- Porcentagem de bateria de íons de lítio: 78%
- Capacidade média da bateria residencial: 13,5 kWh
Microgrades emergentes e soluções de energia descentralizadas
O Havaí implementou 22 microgrides operacionais em 2023, com capacidade total de micrograde de 47,6 MW. Os projetos de microrda baseados na comunidade aumentaram 15% em comparação com o ano anterior.
| Métrica microgrid | 2023 dados |
|---|---|
| Microgrades operacionais | 22 |
| Capacidade total da microgridez | 47,6 MW |
| Crescimento anual do projeto de microrda | 15% |
Potencial para infraestrutura de carregamento de veículos elétricos como serviço de energia alternativa
O Havaí registrou 33.750 veículos elétricos em 2023, com 1.275 estações de cobrança pública. O investimento em infraestrutura de cobrança de EV atingiu US $ 42,3 milhões, representando um aumento de 22% em relação a 2022.
- Veículos elétricos registrados: 33.750
- Estações de carregamento público: 1.275
- Investimento de infraestrutura de cobrança de EV: US $ 42,3 milhões
Hawaiian Electric Industries, Inc. (He) - As cinco forças de Porter: ameaça de novos participantes
Requisitos de investimento de capital
A Hawaiian Electric Industries requer aproximadamente US $ 1,4 bilhão em investimentos totais de plantas de serviços públicos a partir de 2023. As despesas médias de capital para desenvolvimento de infraestrutura de utilidade varia entre US $ 250 e US $ 350 milhões anualmente.
| Categoria de investimento | Intervalo de custos |
|---|---|
| Infraestrutura da grade | US $ 450 a US $ 600 milhões |
| Projetos de energia renovável | US $ 350 a US $ 500 milhões |
| Sistemas de transmissão | US $ 200 a US $ 300 milhões |
Barreiras regulatórias
A Comissão de Utilidade Pública do Havaí impõe rigorosas requisitos regulatórios com mais de 127 mandatos de conformidade específicos Para entrada do mercado de serviços públicos.
- Conformidade padrão de portfólio renovável
- Regulamentos de interconexão da grade
- Avaliações de impacto ambiental
- Processos de aprovação de investimento de capital
Desafios de entrada no mercado
As indústrias elétricas havaianas controlam 95% da distribuição de eletricidade nas ilhas havaianas. Novos participantes enfrentam desafios significativos de penetração no mercado.
| Característica do mercado | Estatística |
|---|---|
| Concentração de mercado | 95% |
| Custo da geração de eletricidade | US $ 0,28 por kWh |
| Cronograma de aprovação regulatória | 36-48 meses |
Limitações geográficas
As indústrias elétricas havaianas opera exclusivamente dentro de 4 ilhas havaianas primárias: Oahu, Havaí, Maui e Lanai, representando um paisagem de expansão geográfica limitada.
- Área de serviço total: 2.700 milhas quadradas
- Base de clientes: 453.000 contas de eletricidade
- Restrições de infraestrutura específicas da ilha
Hawaiian Electric Industries, Inc. (HE) - Porter's Five Forces: Competitive rivalry
When you look at Hawaiian Electric Industries, Inc. (HE), the competitive rivalry force is split. On one hand, the traditional, direct competition is heavily constrained, but on the other, the landscape of power generation is becoming more dynamic, shifting the nature of rivalry.
Direct Rivalry: The Regulated Structure
Direct rivalry is low because Hawaiian Electric Industries, Inc. operates under a regulated, franchised monopoly structure. This utility supplies power to 95% of the residents across Oahu, Maui, Molokai, Lanai, and Hawaii Island. This structure historically limits direct head-to-head competition for basic electricity delivery services.
However, you should note that this structure is facing a significant, legislated change. Starting in 2027, Hawai'i's new "wheeling" law will allow smaller producers to use Hawaiian Electric Industries, Inc.'s infrastructure by paying a set fee, which could erode that century-old monopoly. This means the near-term rivalry is low, but the long-term threat of direct market entry is being established now.
Indirect Rivalry: The Rise of Independent Power Producers
Indirect rivalry, though, is quite high, primarily driven by Independent Power Producers (IPPs) and the increasing decentralization of generation sources. These IPPs contribute a substantial portion of the power mix, especially on the more populated islands. For instance, on Oahu alone, IPPs contribute significant firm capacity, such as Kalaeloa Partners at 208 MW and H-POWER at 68.5 MW, alongside numerous variable renewable sources.
To give you a clearer picture of the operational scale and where the competition for power supply lies, here are some key figures from the end of 2024 and Q2 2025:
| Metric | Value | Context/Date |
|---|---|---|
| Market Share (Customers Served) | 95% | Residents of the State of Hawaii |
| Consolidated Core Net Income | $35.4 million | Second Quarter 2025 |
| Utility Core Net Income | $42.5 million | Second Quarter 2025 |
| Wildfire Safety Strategy Cost (Total) | $450 million | Estimated for 2025-2027 |
| Wildfire Safety Strategy CapEx | $400 million | Part of the 2025-2027 strategy |
| 2025 Budgeted Wildfire Work | $137 million | Budgeted for 2025 within the 3-year plan |
| Wheeling Law Implementation | 2027 | Start date for third-party transmission access |
Shifting Competition to Grid Resilience
The focus of competitive pressure is clearly moving away from traditional market share battles and toward demonstrating superior grid resilience and safety. Hawaiian Electric Industries, Inc. is heavily invested in its $450 million Wildfire Safety Strategy spanning 2025-2027. This massive capital outlay, which includes $400 million in capital expenditures, is essentially a competition with nature and regulatory expectation, rather than a rival utility.
The utility is spending to fortify infrastructure, deploy new technology, and minimize fire hazards. This focus is critical because operational failures, like those leading to the Maui wildfires, directly impact regulatory standing and financial stability. The company's Q2 2025 performance reflects this tension.
- Utility core net income was $42.5 million in Q2 2025, a slight dip from $43.9 million in Q2 2024.
- This decrease was driven by higher wildfire mitigation program expenses and increased insurance costs.
- The consolidated core net income, excluding specific items, was $35.4 million for Q2 2025.
The operational focus is clear: manage the immediate costs of safety while navigating the legal fallout. The utility's ability to execute this multi-year safety plan effectively will define its competitive standing with regulators and the public.
Operational Focus Amidst Legal Challenges
You see the operational focus in the Q2 2025 results. While the utility's core income saw a slight decrease to $42.5 million from $43.9 million year-over-year, the consolidated core net income was reported at $35.4 million. This figure, which excludes certain expenses, shows the underlying business is performing, even as the company deals with the aftermath of past events and the massive investment required for future safety.
The holding company also showed improvement, with its core net loss narrowing to $7.1 million in Q2 2025 from $15.5 million in Q2 2024, partly due to lower interest expense following debt retirement. This financial discipline is necessary to fund the resilience efforts. The competition here is internal: successfully executing the simplification strategy and managing liabilities while funding the $450 million safety plan.
Hawaiian Electric Industries, Inc. (HE) - Porter\'s Five Forces: Threat of substitutes
You're looking at the direct impact of customer choices on Hawaiian Electric Industries, Inc. (HE)'s core business-selling electrons. The threat of substitutes here is very real and driven by technology adoption and state policy, effectively allowing customers to generate or save their own power.
Rooftop solar photovoltaic (PV) is the primary substitute, and the numbers show just how much it's chipping away at traditional sales volume. Renewable energy sources resulted in 35.8 percent of total generation in 2024, a figure that directly reflects the success of customer-sited generation alongside utility-scale projects. Solar Photovoltaic specifically accounted for 646 GWh of that renewable generation in 2024. By September 2025, the total number of grid-connected solar systems on the five islands served by Hawaiian Electric Industries, Inc. (HE) had climbed to 118,841 systems. This penetration is deep; systemwide, 45 percent of single-family homes now have solar systems. On Oahu, that figure is nearly half at an estimated 49 percent of single-family homes, with Maui County following closely at 47 percent as of late 2025. This customer-owned capacity is significant; the total solar generating capacity, including all types, reached 1,410 MW by the end of 2024. Honestly, this decentralized generation puts direct pressure on the need for new centralized capacity from Hawaiian Electric Industries, Inc. (HE).
Battery Energy Storage Systems (BESS) paired with solar are the next level of substitution, allowing large users to reduce or eliminate grid reliance, especially during peak times. This trend is visible even in utility-scale procurement, where new projects are mandated to include storage. For instance, the Hoohana Solar I project, expected to complete commissioning in 2025, includes a 208 MWh BESS. Other 2024 additions like AES Kuihelani Solar included 240 MWh of BESS capacity. While the state is still establishing clear rules for customer-sited microgrids, legislation supports harnessing these systems for resilience, meaning large commercial or industrial users can increasingly disconnect or self-supply during outages or high-cost periods. This capability offers a direct hedge against utility price volatility.
State-mandated energy efficiency and demand-side management programs directly reduce the demand for Hawaiian Electric Industries, Inc. (HE)'s sales volume, acting as a 'negative load' substitute. The state has an Energy-Efficiency Portfolio Standard requiring 4,300 GWh of electricity use reductions statewide by 2030, relative to a 2008 baseline. Furthermore, lawmakers are advancing House Bill 1051 to set an even more aggressive target of 6,000 GWh in reductions by 2045. The Public Utilities Commission is directed to establish interim goals, including one for 2025, ensuring continuous pressure to lower overall consumption, which directly lowers the volume of energy Hawaiian Electric Industries, Inc. (HE) needs to sell.
New legislation supports clean energy procurement, which, while often involving Hawaiian Electric Industries, Inc. (HE) as the procurement agent, accelerates the shift away from legacy fossil fuel generation, which is the company's traditional revenue base. Hawaiian Electric Industries, Inc. (HE) achieved a 36 percent consolidated Renewable Portfolio Standard (RPS) in 2024, moving toward the 2030 RPS milestone of 40 percent, with the ultimate state goal being 100 percent renewable energy by 2045. The state's commitment was further solidified in October 2025 with a Strategic Partnering Agreement with JERA to accelerate the retirement of aging assets. This regulatory environment forces capital away from traditional thermal generation and into contracted renewables, which changes the risk profile of the existing asset base.
Here is a look at the key renewable and efficiency targets impacting the substitute threat:
| Metric | Value | Context/Date |
|---|---|---|
| Consolidated RPS Achieved | 35.8 percent | 2024 Generation Mix |
| 2030 RPS Milestone Target | 40 percent | State Goal |
| Total Grid-Connected Solar Systems | 118,841 | End of September 2025 |
| Single-Family Home Solar Penetration (Systemwide) | 45 percent | As of September 2025 |
| 2030 Energy Efficiency Reduction Goal | 4,300 GWh | Electricity Use Reductions by 2030 |
| 2045 Energy Efficiency Reduction Goal (Proposed) | 6,000 GWh | House Bill 1051 Target |
The growth in customer-sited solar capacity is clearly outpacing the utility's ability to integrate it without significant grid upgrades. For example, new private rooftop solar additions in 2024 totaled 61 MW. If that pace continued, the cumulative distributed solar capacity was forecasted to exceed 1,186 MW by 2030. That's a massive amount of self-supply that Hawaiian Electric Industries, Inc. (HE) cannot bill for.
Hawaiian Electric Industries, Inc. (HE) - Porter's Five Forces: Threat of new entrants
The threat of new entrants for Hawaiian Electric Industries, Inc. remains exceptionally low, primarily due to massive sunk costs, entrenched regulatory control, and significant post-disaster financial structuring that creates a high hurdle for any potential competitor.
- Capital requirements are extremely high for new utility-scale infrastructure in an isolated island chain.
- Regulatory barriers are significant; the Hawaii PUC must approve any new utility franchise.
- New legislation authorizing securitization for $500,000,000 in grid improvements raises the barrier for any competitor to match infrastructure scale.
- The state's liability cap for future wildfire damages reduces a key risk for Hawaiian Electric Industries, Inc., but the inherent environmental risk deters new entrants.
The sheer scale of necessary investment acts as a primary deterrent. Consider the estimated capital required for just one potential future fuel source pathway; the investment necessary to incorporate LNG into O'ahu's energy mix at scale is cited as more than $2 billion.
This existing infrastructure hurdle is compounded by the regulatory environment. The Hawaii Public Utilities Commission (PUC) is the franchised provider regulator for Oahu, Hawaii Island, Maui, Lanai, and Molokai. Any new entrant would face the same, if not more stringent, scrutiny from the PUC, which must approve any new utility franchise.
Furthermore, recent legislative actions have effectively raised the bar for infrastructure parity, particularly concerning grid hardening and risk management. The framework now includes mechanisms that a new entrant would need to replicate or overcome:
| Barrier Component | Associated Financial/Legislative Figure | Source Context |
|---|---|---|
| Securitization for Resilience Investment | $500,000,000 | First tranche of infrastructure resilience capital investments authorized for securitization under SB897 |
| Maui Wildfire Settlement Contribution | $1,990,000,000 (pre-tax) | Hawaiian Electric Industries, Inc.'s total contribution to the global settlement |
| Projected Near-Term Grid Investment (HEI) | $350,000,000 (3-year plan) | Total projected cost of Hawaiian Electric Industries, Inc.'s expanded Wildfire Safety Strategy |
| Projected First Wildfire Payment | $479,000,000 | First scheduled payment in early 2026 related to the Maui wildfire settlement |
| Estimated LNG Infrastructure Cost | > $2,000,000,000 | Investment necessary to incorporate LNG into O'ahu's energy mix at scale |
The regulatory framework now actively supports Hawaiian Electric Industries, Inc. in managing catastrophic risk, which is a major deterrent for new entrants. The PUC is tasked with determining the maximum liability cap for future catastrophic wildfires, a structure that emerged after the $1.99 billion pre-tax settlement contribution. While the inherent environmental risk of operating in an isolated island chain remains, the legislative mitigation of financial downside for the incumbent utility significantly alters the risk-reward calculation for a challenger.
New entrants face the challenge of matching the incumbent's scale and regulatory integration. For instance, the PUC recently approved a 25.75% rate increase for Young Brothers LLC, showcasing the commission's direct control over regulated entity pricing and operational stability.
Disclaimer
All information, articles, and product details provided on this website are for general informational and educational purposes only. We do not claim any ownership over, nor do we intend to infringe upon, any trademarks, copyrights, logos, brand names, or other intellectual property mentioned or depicted on this site. Such intellectual property remains the property of its respective owners, and any references here are made solely for identification or informational purposes, without implying any affiliation, endorsement, or partnership.
We make no representations or warranties, express or implied, regarding the accuracy, completeness, or suitability of any content or products presented. Nothing on this website should be construed as legal, tax, investment, financial, medical, or other professional advice. In addition, no part of this site—including articles or product references—constitutes a solicitation, recommendation, endorsement, advertisement, or offer to buy or sell any securities, franchises, or other financial instruments, particularly in jurisdictions where such activity would be unlawful.
All content is of a general nature and may not address the specific circumstances of any individual or entity. It is not a substitute for professional advice or services. Any actions you take based on the information provided here are strictly at your own risk. You accept full responsibility for any decisions or outcomes arising from your use of this website and agree to release us from any liability in connection with your use of, or reliance upon, the content or products found herein.