
|
Avaliação DCF da Yelp Inc. (Yelp) |
Totalmente Editável: Adapte-Se Às Suas Necessidades No Excel Ou Planilhas
Design Profissional: Modelos Confiáveis E Padrão Da Indústria
Pré-Construídos Para Uso Rápido E Eficiente
Compatível com MAC/PC, totalmente desbloqueado
Não É Necessária Experiência; Fácil De Seguir
Yelp Inc. (YELP) Bundle
Aprimore sua estratégia de investimento com a calculadora DCF da Yelp Inc. (Yelp)! Recuperar dados financeiros precisos do Yelp, ajustar as projeções e despesas de crescimento e testemunhar como essas modificações afetam o valor intrínseco da Yelp Inc. (Yelp) em tempo real.
What You Will Get
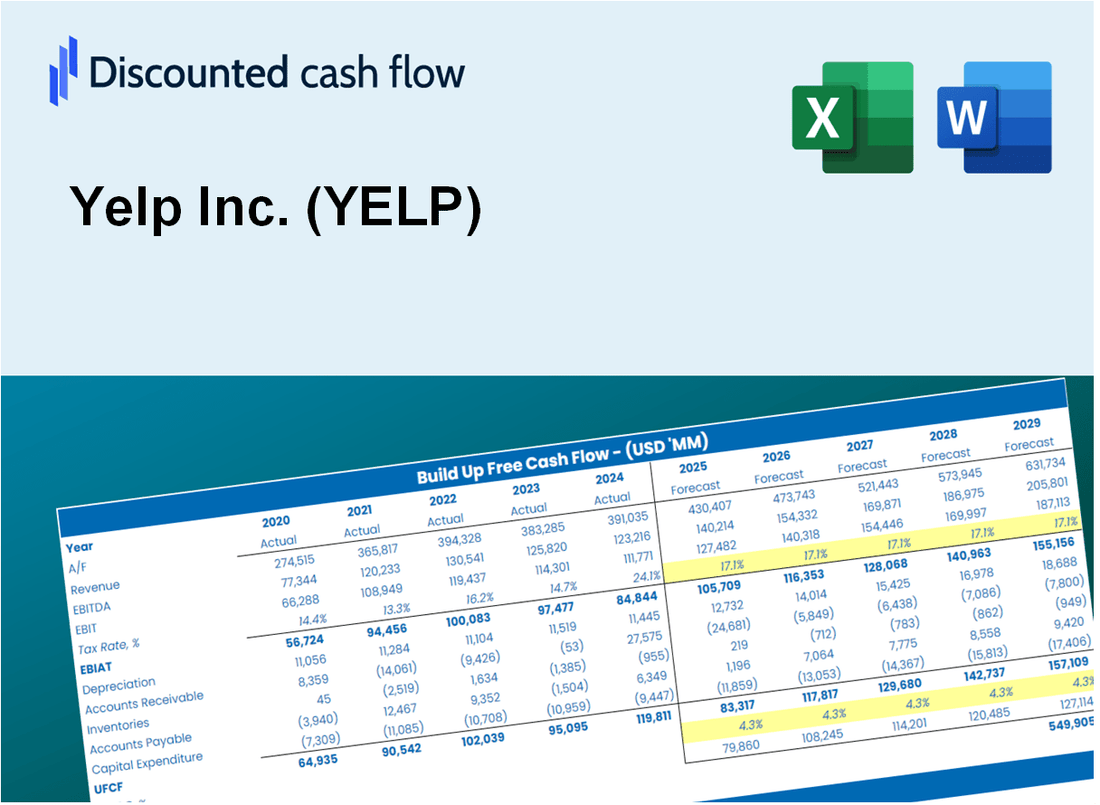
- Editable Excel Template: A fully customizable Excel-based DCF Calculator with pre-filled real YELP financials.
- Real-World Data: Historical data and forward-looking estimates (as shown in the yellow cells).
- Forecast Flexibility: Change forecast assumptions like revenue growth, EBITDA %, and WACC.
- Automatic Calculations: Instantly see the impact of your inputs on Yelp’s valuation.
- Professional Tool: Built for investors, CFOs, consultants, and financial analysts.
- User-Friendly Design: Structured for clarity and ease of use, with step-by-step instructions.
Key Features
- Comprehensive DCF Calculator: Features detailed unlevered and levered DCF valuation models tailored for Yelp Inc. (YELP).
- WACC Calculator: Includes a pre-configured Weighted Average Cost of Capital sheet with adjustable parameters.
- Customizable Forecast Assumptions: Easily alter growth projections, capital expenditures, and discount rates.
- Integrated Financial Ratios: Evaluate profitability, leverage, and efficiency ratios specific to Yelp Inc. (YELP).
- Interactive Dashboard and Charts: Visual representations of key valuation metrics for streamlined analysis.
How It Works
- Step 1: Download the Excel file.
- Step 2: Review pre-entered Yelp Inc. (YELP) data (historical and projected).
- Step 3: Adjust key assumptions (yellow cells) based on your analysis.
- Step 4: View automatic recalculations for Yelp Inc.'s (YELP) intrinsic value.
- Step 5: Use the outputs for investment decisions or reporting.
Why Choose This Calculator for Yelp Inc. (YELP)?
- Designed for Experts: A sophisticated tool tailored for analysts, CFOs, and industry consultants.
- Comprehensive Data: Yelp’s historical and projected financials are preloaded for enhanced accuracy.
- Flexible Scenario Analysis: Effortlessly simulate various forecasts and assumptions.
- Insightful Outputs: Automatically computes intrinsic value, NPV, and essential metrics.
- User-Friendly Interface: Step-by-step guidance ensures a smooth experience throughout the process.
Who Should Use This Product?
- Investors: Accurately assess Yelp Inc.’s (YELP) fair value before making investment choices.
- CFOs: Utilize a professional-grade DCF model for financial analysis and reporting.
- Consultants: Easily customize the template for client valuation reports.
- Entrepreneurs: Acquire knowledge of financial modeling practices employed by leading companies.
- Educators: Implement it as a teaching resource to illustrate valuation techniques.
What the Template Contains
- Preloaded YELP Data: Historical and projected financial data, including revenue, EBIT, and capital expenditures.
- DCF and WACC Models: Professional-grade sheets for calculating intrinsic value and Weighted Average Cost of Capital.
- Editable Inputs: Yellow-highlighted cells for adjusting revenue growth, tax rates, and discount rates.
- Financial Statements: Comprehensive annual and quarterly financials for deeper analysis.
- Key Ratios: Profitability, leverage, and efficiency ratios to evaluate performance.
- Dashboard and Charts: Visual summaries of valuation outcomes and assumptions.
Disclaimer
All information, articles, and product details provided on this website are for general informational and educational purposes only. We do not claim any ownership over, nor do we intend to infringe upon, any trademarks, copyrights, logos, brand names, or other intellectual property mentioned or depicted on this site. Such intellectual property remains the property of its respective owners, and any references here are made solely for identification or informational purposes, without implying any affiliation, endorsement, or partnership.
We make no representations or warranties, express or implied, regarding the accuracy, completeness, or suitability of any content or products presented. Nothing on this website should be construed as legal, tax, investment, financial, medical, or other professional advice. In addition, no part of this site—including articles or product references—constitutes a solicitation, recommendation, endorsement, advertisement, or offer to buy or sell any securities, franchises, or other financial instruments, particularly in jurisdictions where such activity would be unlawful.
All content is of a general nature and may not address the specific circumstances of any individual or entity. It is not a substitute for professional advice or services. Any actions you take based on the information provided here are strictly at your own risk. You accept full responsibility for any decisions or outcomes arising from your use of this website and agree to release us from any liability in connection with your use of, or reliance upon, the content or products found herein.