
|
Yelp Inc. (Yelp): 5 forças Análise [Jan-2025 Atualizada] |
Totalmente Editável: Adapte-Se Às Suas Necessidades No Excel Ou Planilhas
Design Profissional: Modelos Confiáveis E Padrão Da Indústria
Pré-Construídos Para Uso Rápido E Eficiente
Compatível com MAC/PC, totalmente desbloqueado
Não É Necessária Experiência; Fácil De Seguir
Yelp Inc. (YELP) Bundle
No cenário digital dinâmico de busca e revisões locais, a Yelp Inc. navega em um ecossistema complexo de forças competitivas que moldam seu posicionamento estratégico. Como uma plataforma fundamental que conecta os consumidores a empresas locais, o Yelp enfrenta desafios intrincados de fornecedores, clientes, rivais, potenciais substitutos e novos participantes do mercado. Essa análise de mergulho profundo usando a estrutura das Five Forces de Michael Porter revela a dinâmica competitiva diferenciada que define o modelo de negócios do Yelp em 2024, oferecendo informações sobre a resiliência, vulnerabilidades potenciais e oportunidades estratégicas da plataforma em um mercado digital cada vez mais lotado.
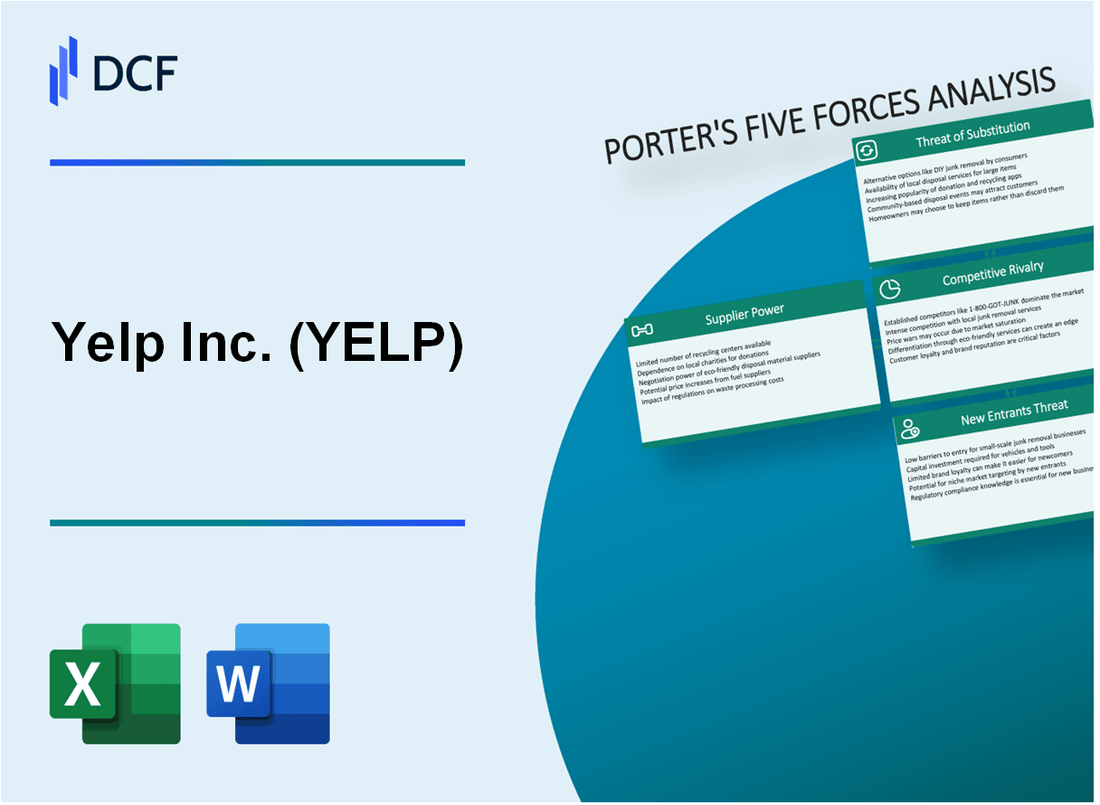
Yelp Inc. (Yelp) - As cinco forças de Porter: poder de barganha dos fornecedores
Número limitado de criadores de conteúdo e contribuintes de revisão
A partir do quarto trimestre de 2023, o Yelp registrou 244 milhões de usuários mensais únicos e aproximadamente 3,1 milhões de locais de negócios totais. A plataforma depende de um grupo diversificado, mas finito, de colaboradores de conteúdo.
| Métrica | Valor |
|---|---|
| Usuários ativos mensais totais | 244 milhões |
| Locais de negócios | 3,1 milhões |
| Colaboradores ativos | Aproximadamente 70-80 milhões de usuários registrados |
Alta dependência de conteúdo gerado pelo usuário
O modelo de negócios da Yelp depende criticamente de críticas e conteúdo gerados pelo usuário, o que cria uma dinâmica exclusiva do fornecedor.
- 95% do conteúdo gerado por colaboradores não pagos
- Submissões de revisão mensal média: 1,4 milhão
- Diversas fontes de conteúdo, incluindo usuários individuais, empresários e revisores profissionais
Custo direto mínimo para contribuições do usuário
A criação de conteúdo do usuário representa um modelo de custo marginal zero para o Yelp, reduzindo a potência de barganha do fornecedor.
| Métricas de contribuição de conteúdo | Valor |
|---|---|
| Custo por revisão | $0 |
| Mecanismos de incentivo | Programa de Revisor de Elite, Reconhecimento Social |
Plataformas de publicidade e provedores de dados alavancam
A receita de publicidade e as parcerias de dados da Yelp envolvem influência moderada do fornecedor.
- 2023 Receita de publicidade: US $ 1,12 bilhão
- A publicidade é responsável por 87% da receita total da empresa
- Os principais parceiros da plataforma de publicidade incluem Google, Facebook e redes programáticas
| Parceiro de publicidade | Contribuição da receita |
|---|---|
| Vendas de publicidade direta | US $ 680 milhões |
| Publicidade programática | US $ 440 milhões |
Yelp Inc. (Yelp) - As cinco forças de Porter: poder de barganha dos clientes
Baixos custos de comutação para usuários entre plataformas de revisão
A partir de 2024, o Yelp enfrenta um poder significativo de negociação de clientes devido a barreiras mínimas de comutação. O tempo médio que um usuário gasta criando um profile Em plataformas de revisão alternativa, é de aproximadamente 3-5 minutos. Os usuários podem fazer a transição facilmente entre as avaliações do Yelp, Google Reviews, TripAdvisor e Facebook sem esforço ou custo substancial.
| Plataforma | Usuários ativos mensais | Tempo médio de troca de usuário |
|---|---|---|
| Yelp | 32,8 milhões | 4 minutos |
| Revisões do Google | 47,6 milhões | 3 minutos |
| TripAdvisor | 22,1 milhões | 5 minutos |
Alta sensibilidade ao preço para serviços de publicidade
A receita de publicidade do Yelp demonstra alta sensibilidade ao preço do cliente. O custo médio de publicidade para pequenas empresas no Yelp varia de US $ 300 a US $ 1.000 por mês, com 68% das empresas comparando constantemente os preços em diferentes plataformas de marketing.
- Custo médio de publicidade mensal: US $ 624
- Porcentagem de empresas comparando preços: 68%
- Duração típica do contrato: 3-6 meses
Várias alternativas gratuitas disponíveis
As plataformas de pesquisa e revisão locais gratuitas afetam significativamente o poder de barganha do cliente da Yelp. O Google Maps, o Facebook Business e o Instagram fornecem recursos gratuitos de listagem e revisão de negócios.
| Plataforma | Listagens de negócios gratuitas | Usuários ativos mensais |
|---|---|---|
| Google Maps | Sim | 154,4 milhões |
| Negócios do Facebook | Sim | 89,7 milhões |
| Sim | 62,3 milhões |
Os usuários têm controle significativo de criação de conteúdo
O conteúdo gerado pelo usuário representa 92% do ecossistema de revisão do Yelp. Em 2024, aproximadamente 78% dos usuários se sentem capacitados a compartilhar experiências detalhadas e não filtradas sem restrições de plataforma.
- Porcentagem de conteúdo gerado pelo usuário: 92%
- Usuários sentindo controle de conteúdo: 78%
- Revisões médias por empresa: 24
Yelp Inc. (Yelp) - As cinco forças de Porter: rivalidade competitiva
Cenário intenso da competição
A partir do quarto trimestre 2023, o Yelp enfrenta uma pressão competitiva significativa das principais plataformas de revisão digital:
| Concorrente | Quota de mercado | Usuários ativos mensais |
|---|---|---|
| Revisões do Google | 54.3% | 230 milhões |
| TripAdvisor | 22.7% | 67 milhões |
| Resenhas do Facebook | 16.5% | 95 milhões |
| Yelp | 6.5% | 33 milhões |
Dinâmica do mercado de publicidade local
O mercado local de publicidade digital demonstra fragmentação significativa:
- Tamanho total do mercado de publicidade digital local: US $ 67,8 bilhões em 2023
- Número de plataformas de publicidade local: 127 concorrentes ativos
- Custo médio de aquisição de clientes: US $ 42 por empresa
- Receita anual de publicidade para Yelp: US $ 1,14 bilhão em 2023
Pressão de inovação
Métricas competitivas destacando os requisitos de inovação:
| Métrica de inovação | 2023 valor |
|---|---|
| Investimento em P&D | US $ 124,5 milhões |
| Novos lançamentos de recursos | 17 grandes atualizações |
| Ciclo de desenvolvimento de produtos | 42 dias em média |
Estratégias de diferenciação
Experiência do usuário e recursos exclusivos Análise comparativa:
- Taxa de verificação de revisão do usuário: 89%
- Recomendação de aprendizado de máquina Precisão: 73%
- Duração média da sessão do usuário: 6,2 minutos
- Mobile App Download Count: 42 milhões
Yelp Inc. (Yelp) - As cinco forças de Porter: ameaça de substitutos
Google Maps e Google Reviews como substitutos primários
O Google Maps registrou 1 bilhão de usuários ativos mensais em 2023. O Google Reviews possui mais de 200 milhões de negócios em todo o mundo. A partir do quarto trimestre de 2023, a participação de mercado de pesquisa local do Google atingiu 94,6% nas plataformas digitais.
| Plataforma | Usuários ativos mensais | Listagens de negócios |
|---|---|---|
| Google Maps | 1,000,000,000 | 200,000,000 |
| Revisões do Google | 800,000,000 | 190,000,000 |
Plataformas de mídia social que oferecem recomendações de negócios locais
O Facebook Local teve 2,9 bilhões de usuários ativos mensais em 2023. As contas comerciais do Instagram excederam 25 milhões em todo o mundo.
- Facebook Local: 2,9 bilhões de usuários ativos mensais
- Negócios do Instagram: 25 milhões de contas comerciais
- Recomendações de negócios locais Tiktok: 1,5 bilhão de usuários ativos mensais
Aplicativos e plataformas de recomendação emergentes
O TripAdvisor registrou 460 milhões de usuários mensais em 2023. O Foursquare manteve 50 milhões de usuários ativos mensais.
| Plataforma | Usuários ativos mensais | Total de revisões |
|---|---|---|
| TripAdvisor | 460,000,000 | 860,000,000 |
| Foursquare | 50,000,000 | 105,000,000 |
Sites de negócios diretos e plataformas de revisão alternativas
O OpenTable processou 1,3 bilhão de clientes em 2023. O TripAdvisor gerou US $ 902 milhões em receita durante o mesmo período.
- Openidade: 1,3 bilhão de clientes anualmente
- Receita do TripAdvisor: US $ 902 milhões em 2023
- Plataformas de revisão alternativas: mais de 500 plataformas de nicho em todo o mundo
Yelp Inc. (Yelp) - As cinco forças de Porter: ameaça de novos participantes
Baixas barreiras técnicas à entrada para plataformas de revisão
As barreiras técnicas para plataformas de revisão permanecem mínimas. A partir de 2024, os custos de desenvolvimento para uma plataforma de revisão básica variam entre US $ 50.000 e US $ 150.000.
| Custo de desenvolvimento da plataforma | Nível de complexidade | Tempo para mercado estimado |
|---|---|---|
| $50,000 - $150,000 | Baixo a médio | 3-6 meses |
Altos custos de aquisição de clientes no mercado de publicidade local
Os custos de aquisição de clientes para empresas locais permanecem significativos. Em 2023, as despesas de vendas e marketing da Yelp foram de US $ 304,7 milhões, representando 34,4% da receita total.
- Custo médio de aquisição de clientes: US $ 25 a US $ 75 por empresa
- Gastes de marketing por novo anunciante: US $ 500- $ 1.500
Necessidade de base de usuários significativos e credibilidade
O Yelp mantém 244 milhões de revisões cumulativas a partir do quarto trimestre de 2023, criando uma barreira substancial para novos participantes.
| Total de revisões | Usuários ativos mensais | Listagens de negócios |
|---|---|---|
| 244 milhões | 33,6 milhões | 5,2 milhões |
Investimento substancial necessário para tecnologia e marketing
Os investimentos em infraestrutura de tecnologia para plataformas de revisão competitiva exigem capital significativo. O investimento inicial estimado em tecnologia varia de US $ 250.000 a US $ 1,5 milhão.
- Custos de infraestrutura em nuvem: US $ 50.000 a US $ 150.000 anualmente
- Aprendizado de máquina inicial e desenvolvimento de IA: US $ 200.000 a US $ 500.000
Efeitos de rede estabelecidos fornecem proteção
Os efeitos da rede do Yelp criam barreiras de entrada substanciais. Em 2023, a plataforma gerou US $ 1,12 bilhão em receita anual, demonstrando um forte posicionamento de mercado.
| Receita anual | Receita de publicidade | Crescimento de receita |
|---|---|---|
| US $ 1,12 bilhão | US $ 988,3 milhões | 5.2% |
Yelp Inc. (YELP) - Porter's Five Forces: Competitive rivalry
You're looking at Yelp Inc. (YELP) in late 2025, and the competitive rivalry force is definitely showing its teeth. The core issue here is the sheer dominance of the incumbent search giant in the local discovery space. We have to acknowledge that Google holds an estimated 94.6% share of the local search market, which immediately sets the bar incredibly high for anyone trying to capture consumer intent at the top of the funnel.
This intense rivalry means Yelp Inc. (YELP) is fighting for the remaining sliver of attention. To put Yelp Inc. (YELP)'s position in context against the major review platforms, its market share is relatively small at 6.5% of that specific segment. This fragmentation is worsened by direct competition from other established players, namely TripAdvisor and Facebook Reviews, which pull user engagement away from Yelp Inc. (YELP)'s core offering.
Here's a quick look at how the review platform landscape breaks down based on recent data, showing just how much of the field is owned by the primary competitor:
| Platform | Cited Market Share (%) | Context |
| 73% | Share of the overall online review platform market | |
| Yelp Inc. (YELP) | 6.5% | Yelp Inc. (YELP)'s required market share figure |
| Facebook Reviews | 3% | Cited market share |
| TripAdvisor | 3% | Cited market share |
The competition isn't just about static review counts anymore; the battlefield is shifting rapidly toward artificial intelligence. The competition is shifting to AI-powered features like Yelp Assistant and automation tools. For instance, Google's AI Overviews, which directly answer user queries, appeared for 13.14% of all Google searches as of March 2025, up from 6.49% in January 2025. This signals that the next phase of rivalry will be won or lost on the quality and speed of AI-generated summaries and recommendations.
Furthermore, the underlying market that Yelp Inc. (YELP) monetizes-local digital advertising-is massive but highly fragmented, which presents both a challenge and an opportunity. The local digital advertising market was valued at $67.8 billion in 2023. By 2025, projections show the total local ad market reaching $171 billion, with total local digital media landing at $89.6 billion. Yelp Inc. (YELP)'s own trailing twelve-month revenue as of September 30, 2025, was $1.47B, showing the scale of the prize even within that fragmented spend.
You need to keep an eye on these key competitive dynamics:
- Google commands 87% of local searchers.
- Google, Facebook, Yelp Inc. (YELP), and TripAdvisor collectively host 88% of all online reviews.
- 74% of consumers check at least two review platforms before deciding.
- Yelp Inc. (YELP) reported 515,000 paying advertising locations as of mid-2025.
- Yelp Inc. (YELP)'s stock price as of October 31, 2025, was $32.98.
Finance: draft a sensitivity analysis on Yelp Inc. (YELP)'s Q4 2025 advertising revenue assuming a 5% market share erosion due to AI-driven search result consolidation by end of Q1 2026.
Yelp Inc. (YELP) - Porter's Five Forces: Threat of substitutes
You're assessing Yelp Inc.'s competitive position, and the threat of substitutes is definitely a major headwind you need to model into your valuation. Honestly, for a platform built on user-generated content and local discovery, the substitutes aren't just other review sites; they are entire ecosystems that have integrated local search into their core offering.
Google Maps/Reviews is the primary substitute, offering integrated search and navigation. This is where the sheer scale of Google's dominance creates immense pressure. Google controls over 89.57% of the mobile search engine market share in the US as of 2025. This means when a consumer searches for "hair salon near me," Google Maps and the Local 3-Pack appear first, heavily influenced by their review system. A 2025 BrightLocal survey showed that 87% of consumers used Google to evaluate a local business in the last year. Furthermore, 83% of consumers check Google reviews, a significantly higher figure than the 44% who check Yelp reviews. The volume of activity is staggering: Google handles about 8.5 billion searches per day, dwarfing Yelp's reported 178 million monthly users.
Here's a quick math comparison showing the scale difference in consumer behavior:
| Metric | Google Ecosystem (Maps/Search) | Yelp Inc. |
|---|---|---|
| Mobile Search Market Share (US, 2025) | 89.57% | N/A (Search Engine) |
| Consumers Checking Reviews (2025) | 83% | 44% |
| Daily/Monthly Activity | Approx. 8.5 billion daily searches | Approx. 178 million monthly users |
| Q3 2025 Services Ad Revenue | Indirectly benefits from high visibility | $244 million |
Social media platforms like Instagram and Facebook provide free business discovery and reviews, often favored by younger demographics. The shift to video-first content, dominated by TikTok, bypasses traditional text-based review sites entirely. As of 2025, TikTok boasts over 1.59 billion monthly active users globally. This platform is now a major discovery engine; 77% of Gen Z use TikTok to discover new products, and 58% of its users shop directly on the app. This video-centric, impulse-driven discovery model directly competes with Yelp's more deliberate, text-heavy browsing experience.
Specialized platforms like Angi (which absorbed Angie's List) substitute Yelp's high-value services segment. While Angi operates on a lead-generation model where service providers pay per contact, its existence as the dominant home services marketplace pulls high-value advertising spend away from Yelp's services category, which reported $244 million in advertising revenue in Q3 2025. A recent analysis noted that Yelp falls short because competition may be pulling attention away, evidenced by a choppy 7.4% average growth in paying advertising accounts. This suggests that for certain verticals, the specialized, curated lead flow of platforms like Angi is preferred by businesses over Yelp's broader directory approach.
Consumers can substitute reviews with direct business websites or word-of-mouth, though this is often layered with digital checks. It's important to note that consumers rarely rely on a single source; a 2025 survey indicated that 74% of consumers check two or more review platforms when researching a business. This means that even if a consumer starts on Yelp, they are highly likely to cross-reference with Google or another source. The challenge for Yelp Inc. is ensuring it remains one of those essential two or more platforms.
The competitive pressure is visible in Yelp Inc.'s own numbers. While Services advertising revenue grew 7% year-over-year to $244 million in Q3 2025, the Restaurants, Retail & Other (RR&O) category saw a 2% year-over-year decline to $114 million. This decline in the RR&O segment reflects ongoing challenges in the operating environment and competitive pressures from food ordering and delivery platforms, which are themselves substitutes for the dining discovery Yelp provides.
You should track these substitution trends closely:
- Google's 89.57% mobile search dominance.
- TikTok's 1.59 billion global MAU for discovery.
- The 74% of consumers checking multiple review sites.
- Yelp's paying advertising locations decreasing 2% year-over-year as of September 30, 2025.
- The 2% revenue decline in Yelp's RR&O segment.
Yelp Inc. (YELP) - Porter's Five Forces: Threat of new entrants
You're looking at the threat of new entrants for Yelp Inc. (YELP), and honestly, the initial hurdle to just start a review site is surprisingly low. The premise that technical barriers to launch a basic review platform are low, perhaps in the $\text{50,000 to \$150,000}$ range for a Minimum Viable Product (MVP) in 2025, holds some water when you look at general SaaS development estimates. However, that initial build cost is a drop in the bucket compared to what it takes to compete effectively.
Here's the quick math on what it takes to build something versus what Yelp already has built. A basic SaaS application in 2025 might start around $\text{30,000}$ to $\text{60,000}$. That's just the code; it doesn't buy you a single user or review. What this estimate hides, though, is the massive, ongoing investment required for trust, scale, and feature parity.
| Metric | New Entrant Initial Cost/Scale | Yelp Inc. Scale (Late 2025/2024 Data) |
|---|---|---|
| Platform Development (Basic SaaS MVP) | Starting at $\text{30,000}$ to $\text{60,000}$ | Not applicable (Sunk cost) |
| Cumulative Reviews | Zero | 308 million as of December 31, 2024 |
| Paying Advertising Locations | Zero | 512K (Monthly average for Q3 2025) |
| Monthly App Users | Zero | 29 million monthly app unique devices (2024) |
The real wall for a new entrant isn't the code; it's the advertising side. Scaling up to challenge Yelp Inc.'s advertiser base means facing their established customer acquisition cost (CAC) for local advertisers, which is a significant barrier to scale. In Q3 2025, Yelp Inc. maintained 512K paying advertising locations. To capture even a fraction of that, a competitor needs to spend heavily on marketing to attract businesses away from a platform where 2.5 million people search daily. For context, Yelp's Sales and Marketing costs in Q2 2025 were $144.6 million.
New entrants struggle to replicate Yelp Inc.'s massive content moat. As of the end of 2024, the platform hosted 308 million cumulative reviews. Furthermore, 76% of those reviews are marked as recommended by Yelp's system, which is the core metric businesses care about for their rating. You can't just buy that; you have to grow it organically over years.
Brand trust and network effects create a strong, though not insurmountable, barrier. Consumers rely on the platform because other consumers are there. With 29 million monthly app users in 2024, the density of both consumers and businesses creates a powerful two-sided network. If you're a consumer, you go where the reviews are; if you're a business, you advertise where the consumers are. It's a classic flywheel.
Yelp Inc.'s aggressive 2025 AI investments raise the product complexity bar for new competitors. In October 2025, Yelp Inc. launched over 35 new AI features, including conversational AI assistants like Yelp Host and Yelp Receptionist, aiming to automate guest management for restaurants. This shift moves Yelp Inc. from just a review site to a direct technology provider, increasing the required R&D spend for any challenger. The momentum is real: AI search API calls surged 20x over the past year, generating an annual run rate revenue surpassing $10 million by Q2 2025. A new entrant needs to match that AI sophistication, not just basic listing functionality, to be taken seriously.
Disclaimer
All information, articles, and product details provided on this website are for general informational and educational purposes only. We do not claim any ownership over, nor do we intend to infringe upon, any trademarks, copyrights, logos, brand names, or other intellectual property mentioned or depicted on this site. Such intellectual property remains the property of its respective owners, and any references here are made solely for identification or informational purposes, without implying any affiliation, endorsement, or partnership.
We make no representations or warranties, express or implied, regarding the accuracy, completeness, or suitability of any content or products presented. Nothing on this website should be construed as legal, tax, investment, financial, medical, or other professional advice. In addition, no part of this site—including articles or product references—constitutes a solicitation, recommendation, endorsement, advertisement, or offer to buy or sell any securities, franchises, or other financial instruments, particularly in jurisdictions where such activity would be unlawful.
All content is of a general nature and may not address the specific circumstances of any individual or entity. It is not a substitute for professional advice or services. Any actions you take based on the information provided here are strictly at your own risk. You accept full responsibility for any decisions or outcomes arising from your use of this website and agree to release us from any liability in connection with your use of, or reliance upon, the content or products found herein.