
|
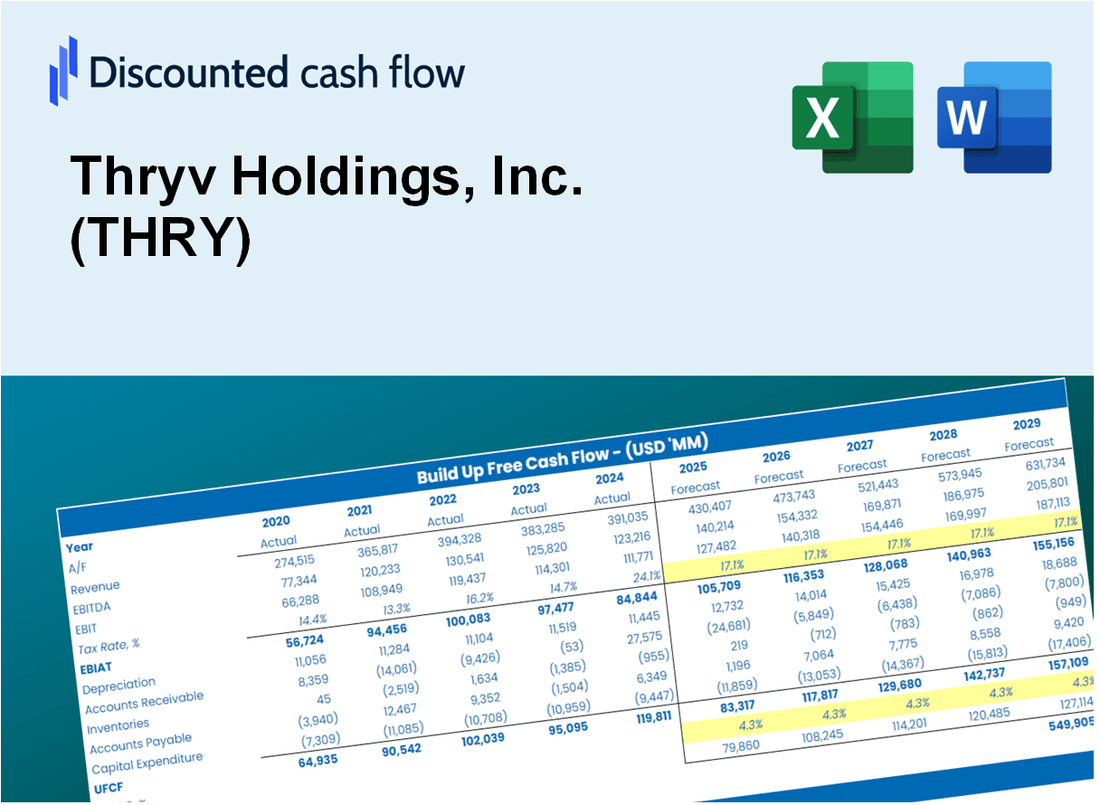
Thryv Holdings, Inc. (Thry) DCF -Bewertung |
Fully Editable: Tailor To Your Needs In Excel Or Sheets
Professional Design: Trusted, Industry-Standard Templates
Investor-Approved Valuation Models
MAC/PC Compatible, Fully Unlocked
No Expertise Is Needed; Easy To Follow
Thryv Holdings, Inc. (THRY) Bundle
Entdecken Sie das wahre Potenzial von Thryv Holdings, Inc. (Thry) mit unserem fortschrittlichen DCF -Taschenrechner! Passen Sie die wichtigsten Annahmen an, erkunden Sie verschiedene Szenarien und untersuchen, wie Schwankungen die Bewertung von Thryv Holdings, Inc. (Thry) beeinflussen - alles innerhalb einer einzigen Excel -Vorlage.
What You Will Get
- Editable Forecast Inputs: Easily modify assumptions (growth %, margins, WACC) to explore various scenarios.
- Real-World Data: Thryv Holdings, Inc.’s financial data pre-filled to kickstart your analysis.
- Automatic DCF Outputs: The template computes Net Present Value (NPV) and intrinsic value for you.
- Customizable and Professional: A sleek Excel model that adjusts to your valuation requirements.
- Built for Analysts and Investors: Perfect for testing projections, validating strategies, and enhancing efficiency.
Key Features
- Comprehensive DCF Calculator: Features detailed unlevered and levered DCF valuation models tailored for Thryv Holdings, Inc. (THRY).
- WACC Calculator: Pre-configured Weighted Average Cost of Capital sheet with adjustable inputs specific to Thryv Holdings, Inc. (THRY).
- Customizable Forecast Assumptions: Adjust growth rates, capital expenditures, and discount rates to fit Thryv Holdings, Inc. (THRY) projections.
- Integrated Financial Ratios: Assess profitability, leverage, and efficiency ratios relevant to Thryv Holdings, Inc. (THRY).
- Interactive Dashboard and Charts: Visual representations summarize key valuation metrics for straightforward analysis of Thryv Holdings, Inc. (THRY).
How It Works
- Download: Obtain the pre-built Excel file containing Thryv Holdings, Inc.'s (THRY) financial data.
- Customize: Modify projections, such as revenue growth, EBITDA %, and WACC.
- Update Automatically: The intrinsic value and NPV calculations refresh in real-time.
- Test Scenarios: Generate various forecasts and instantly compare results.
- Make Decisions: Leverage the valuation outcomes to inform your investment approach.
Why Choose This Calculator for Thryv Holdings, Inc. (THRY)?
- All-in-One Solution: Combines DCF, WACC, and financial ratio analyses tailored for Thryv Holdings.
- Flexible Inputs: Modify the yellow-highlighted cells to explore different financial scenarios.
- In-Depth Analysis: Automatically computes Thryv Holdings’ intrinsic value and Net Present Value.
- Preloaded Information: Historical and projected data provide a solid foundation for analysis.
- Expert-Level Tool: Perfect for financial analysts, investors, and business consultants focused on Thryv Holdings.
Who Should Use This Product?
- Investors: Accurately estimate Thryv Holdings, Inc.'s (THRY) fair value before making investment decisions.
- CFOs: Utilize a professional-grade DCF model for financial reporting and analysis specific to Thryv Holdings, Inc. (THRY).
- Consultants: Quickly customize the template for valuation reports tailored to Thryv Holdings, Inc. (THRY) clients.
- Entrepreneurs: Acquire insights into financial modeling techniques employed by successful companies like Thryv Holdings, Inc. (THRY).
- Educators: Implement it as a teaching resource to illustrate valuation methodologies relevant to Thryv Holdings, Inc. (THRY).
What the Template Contains
- Pre-Filled Data: Includes Thryv Holdings, Inc.'s historical financials and forecasts.
- Discounted Cash Flow Model: Editable DCF valuation model with automatic calculations.
- Weighted Average Cost of Capital (WACC): A dedicated sheet for calculating WACC based on custom inputs.
- Key Financial Ratios: Analyze Thryv Holdings, Inc.'s profitability, efficiency, and leverage.
- Customizable Inputs: Edit revenue growth, margins, and tax rates with ease.
- Clear Dashboard: Charts and tables summarizing key valuation results.
Disclaimer
All information, articles, and product details provided on this website are for general informational and educational purposes only. We do not claim any ownership over, nor do we intend to infringe upon, any trademarks, copyrights, logos, brand names, or other intellectual property mentioned or depicted on this site. Such intellectual property remains the property of its respective owners, and any references here are made solely for identification or informational purposes, without implying any affiliation, endorsement, or partnership.
We make no representations or warranties, express or implied, regarding the accuracy, completeness, or suitability of any content or products presented. Nothing on this website should be construed as legal, tax, investment, financial, medical, or other professional advice. In addition, no part of this site—including articles or product references—constitutes a solicitation, recommendation, endorsement, advertisement, or offer to buy or sell any securities, franchises, or other financial instruments, particularly in jurisdictions where such activity would be unlawful.
All content is of a general nature and may not address the specific circumstances of any individual or entity. It is not a substitute for professional advice or services. Any actions you take based on the information provided here are strictly at your own risk. You accept full responsibility for any decisions or outcomes arising from your use of this website and agree to release us from any liability in connection with your use of, or reliance upon, the content or products found herein.