
|
Tilly's, Inc. (Tlys) DCF -Bewertung |
Fully Editable: Tailor To Your Needs In Excel Or Sheets
Professional Design: Trusted, Industry-Standard Templates
Investor-Approved Valuation Models
MAC/PC Compatible, Fully Unlocked
No Expertise Is Needed; Easy To Follow
Tilly's, Inc. (TLYS) Bundle
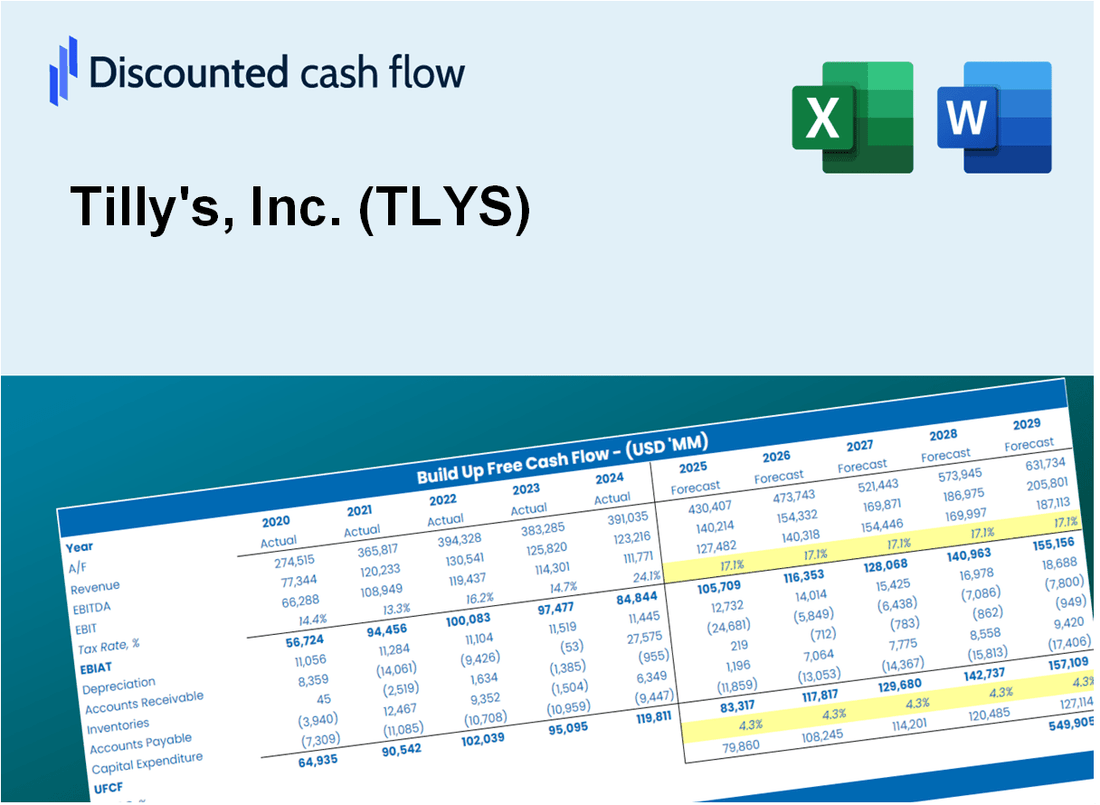
Gewinnen Sie einen Einblick in die Bewertungsanalyse Ihrer Tilly's, Inc. (TLYS) mit unserem ausgeklügelten DCF -Taschenrechner! Diese Excel -Vorlage wird mit realen (TLYS) Daten vorinstalliert, sodass Sie Prognosen und Annahmen anpassen können, um den inneren Wert von Tilly's, Inc. (TLYS) genau zu bestimmen.
What You Will Get
- Editable Excel Template: A fully customizable Excel-based DCF Calculator featuring pre-filled real TLYS financials.
- Real-World Data: Historical data and forward-looking estimates (as indicated in the yellow cells).
- Forecast Flexibility: Adjust forecast assumptions such as revenue growth, EBITDA %, and WACC.
- Automatic Calculations: Instantly observe how your inputs affect Tilly's valuation.
- Professional Tool: Designed for investors, CFOs, consultants, and financial analysts.
- User-Friendly Design: Organized for clarity and ease of use, complete with step-by-step instructions.
Key Features
- Customizable Financial Inputs: Adjust essential metrics such as sales growth, gross margin %, and operating expenses.
- Instant DCF Valuation: Provides immediate calculations for intrinsic value, NPV, and various financial outputs.
- High-Precision Accuracy: Leverages Tilly's real-world financial data for authentic valuation results.
- Effortless Scenario Analysis: Easily explore different scenarios and evaluate their impacts side by side.
- Efficiency Booster: Streamlines the process, removing the need to construct intricate valuation models from the ground up.
How It Works
- Step 1: Download the Excel file for Tilly's, Inc. (TLYS).
- Step 2: Review Tilly's pre-filled financial data and forecasts.
- Step 3: Adjust key inputs such as revenue growth, WACC, and tax rates (highlighted cells).
- Step 4: Observe the DCF model update in real-time as you modify assumptions.
- Step 5: Evaluate the outputs and leverage the results for investment decisions.
Why Choose This Calculator?
- Accurate Data: Up-to-date Tilly's financials provide dependable valuation outcomes.
- Customizable: Modify essential parameters such as growth rates, WACC, and tax rates to align with your forecasts.
- Time-Saving: Pre-configured calculations save you from starting from the ground up.
- Professional-Grade Tool: Tailored for investors, analysts, and consultants focused on Tilly's, Inc. (TLYS).
- User-Friendly: Easy-to-navigate design and clear instructions make it accessible for everyone.
Who Should Use This Product?
- Investors: Accurately assess Tilly's, Inc. (TLYS) fair value prior to making investment choices.
- CFOs: Utilize a professional-grade DCF model for financial analysis and reporting.
- Consultants: Quickly modify the template for client valuation reports.
- Entrepreneurs: Acquire insights into financial modeling techniques employed by leading retail companies.
- Educators: Implement it as a teaching resource to illustrate valuation methods.
What the Template Contains
- Historical Data: Includes Tilly's past financials and baseline forecasts.
- DCF and Levered DCF Models: Detailed templates to calculate Tilly's intrinsic value.
- WACC Sheet: Pre-built calculations for Weighted Average Cost of Capital.
- Editable Inputs: Modify key drivers like growth rates, EBITDA %, and CAPEX assumptions.
- Quarterly and Annual Statements: A complete breakdown of Tilly's financials.
- Interactive Dashboard: Visualize valuation results and projections dynamically.
Disclaimer
All information, articles, and product details provided on this website are for general informational and educational purposes only. We do not claim any ownership over, nor do we intend to infringe upon, any trademarks, copyrights, logos, brand names, or other intellectual property mentioned or depicted on this site. Such intellectual property remains the property of its respective owners, and any references here are made solely for identification or informational purposes, without implying any affiliation, endorsement, or partnership.
We make no representations or warranties, express or implied, regarding the accuracy, completeness, or suitability of any content or products presented. Nothing on this website should be construed as legal, tax, investment, financial, medical, or other professional advice. In addition, no part of this site—including articles or product references—constitutes a solicitation, recommendation, endorsement, advertisement, or offer to buy or sell any securities, franchises, or other financial instruments, particularly in jurisdictions where such activity would be unlawful.
All content is of a general nature and may not address the specific circumstances of any individual or entity. It is not a substitute for professional advice or services. Any actions you take based on the information provided here are strictly at your own risk. You accept full responsibility for any decisions or outcomes arising from your use of this website and agree to release us from any liability in connection with your use of, or reliance upon, the content or products found herein.