
|
Workhorse Group Inc. (WKHS) DCF -Bewertung |
Fully Editable: Tailor To Your Needs In Excel Or Sheets
Professional Design: Trusted, Industry-Standard Templates
Investor-Approved Valuation Models
MAC/PC Compatible, Fully Unlocked
No Expertise Is Needed; Easy To Follow
Workhorse Group Inc. (WKHS) Bundle
Möchten Sie den inneren Wert der Workhorse Group Inc. bestimmen? Unser WKHS-DCF-Taschenrechner integriert reale Daten mit umfangreichen Anpassungsfunktionen, sodass Sie Prognosen anpassen und Ihre Investitionsauswahl verbessern können.
What You Will Receive
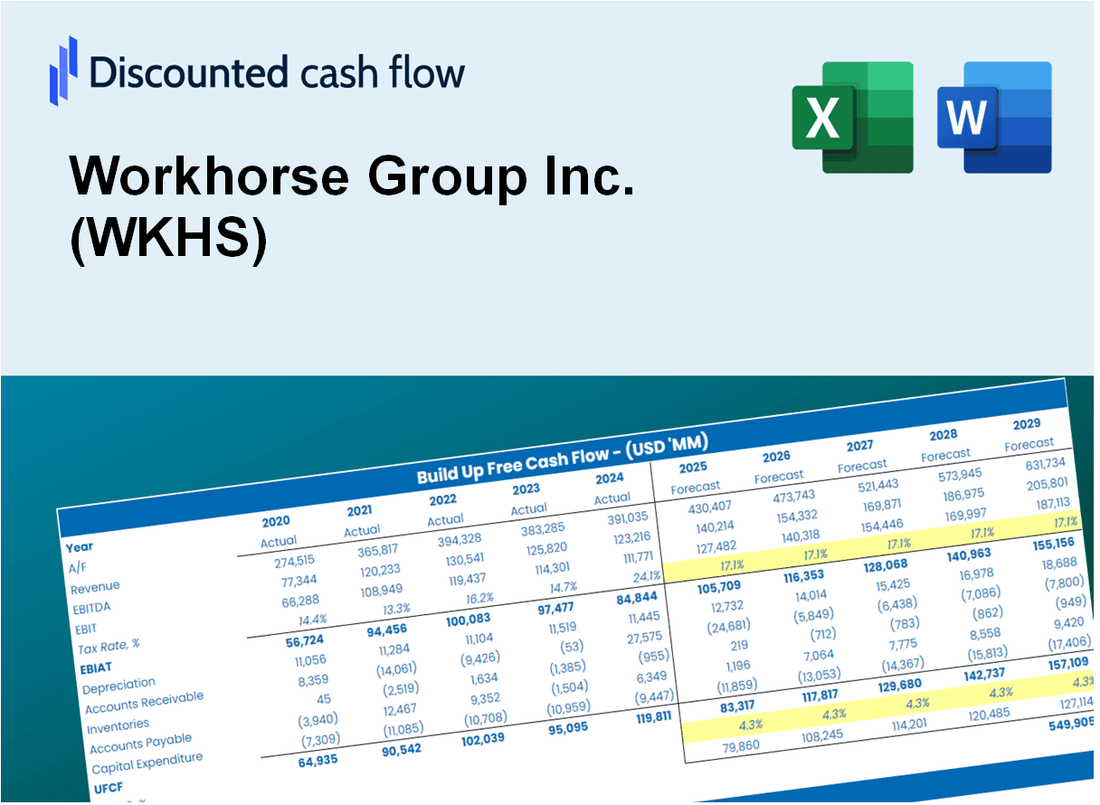
- Pre-Filled Financial Model: Workhorse Group Inc.’s (WKHS) real data allows for accurate DCF valuation.
- Comprehensive Forecast Control: Modify revenue growth, profit margins, WACC, and other essential factors.
- Real-Time Calculations: Automatic updates provide immediate results as you adjust inputs.
- Investor-Ready Template: A polished Excel file crafted for high-quality valuation.
- Customizable and Reusable: Designed for adaptability, enabling repeated use for in-depth forecasts.
Key Features
- Comprehensive DCF Calculator: Features detailed unlevered and levered DCF valuation models tailored for Workhorse Group Inc. (WKHS).
- WACC Calculator: Includes a pre-built Weighted Average Cost of Capital sheet with adjustable inputs specific to WKHS.
- Customizable Forecast Assumptions: Alter growth rates, capital expenditures, and discount rates to fit Workhorse's financial projections.
- Integrated Financial Ratios: Evaluate profitability, leverage, and efficiency ratios relevant to Workhorse Group Inc. (WKHS).
- Interactive Dashboard and Charts: Visual representations summarize essential valuation metrics for straightforward analysis.
How It Works
- Step 1: Download the Excel file.
- Step 2: Review pre-entered Workhorse Group Inc. (WKHS) data (historical and projected).
- Step 3: Adjust key assumptions (yellow cells) based on your analysis.
- Step 4: View automatic recalculations for Workhorse Group Inc.'s (WKHS) intrinsic value.
- Step 5: Use the outputs for investment decisions or reporting.
Why Choose This Calculator for Workhorse Group Inc. (WKHS)?
- Designed for Industry Experts: A sophisticated tool tailored for analysts, CFOs, and consultants in the automotive sector.
- Comprehensive Financial Data: Workhorse Group's historical and projected financials preloaded for precise analysis.
- Flexible Scenario Analysis: Effortlessly test various forecasts and assumptions to explore potential outcomes.
- Insightful Outputs: Automatically computes intrinsic value, NPV, and essential financial metrics.
- User-Friendly Interface: Clear, step-by-step guidance to help you navigate the calculation process.
Who Should Use This Product?
- Investors: Accurately assess Workhorse Group Inc.'s (WKHS) fair value prior to making investment choices.
- CFOs: Utilize a professional-grade DCF model for comprehensive financial reporting and analysis.
- Consultants: Effortlessly modify the template for client valuation reports.
- Entrepreneurs: Gain valuable insights into financial modeling practices employed by leading companies.
- Educators: Employ it as an educational resource to illustrate valuation methodologies.
What the Template Contains
- Pre-Filled Data: Includes Workhorse Group Inc.'s (WKHS) historical financials and forecasts.
- Discounted Cash Flow Model: Editable DCF valuation model with automatic calculations.
- Weighted Average Cost of Capital (WACC): A dedicated sheet for calculating WACC based on custom inputs.
- Key Financial Ratios: Analyze Workhorse Group Inc.'s (WKHS) profitability, efficiency, and leverage.
- Customizable Inputs: Edit revenue growth, margins, and tax rates with ease.
- Clear Dashboard: Charts and tables summarizing key valuation results.
Disclaimer
All information, articles, and product details provided on this website are for general informational and educational purposes only. We do not claim any ownership over, nor do we intend to infringe upon, any trademarks, copyrights, logos, brand names, or other intellectual property mentioned or depicted on this site. Such intellectual property remains the property of its respective owners, and any references here are made solely for identification or informational purposes, without implying any affiliation, endorsement, or partnership.
We make no representations or warranties, express or implied, regarding the accuracy, completeness, or suitability of any content or products presented. Nothing on this website should be construed as legal, tax, investment, financial, medical, or other professional advice. In addition, no part of this site—including articles or product references—constitutes a solicitation, recommendation, endorsement, advertisement, or offer to buy or sell any securities, franchises, or other financial instruments, particularly in jurisdictions where such activity would be unlawful.
All content is of a general nature and may not address the specific circumstances of any individual or entity. It is not a substitute for professional advice or services. Any actions you take based on the information provided here are strictly at your own risk. You accept full responsibility for any decisions or outcomes arising from your use of this website and agree to release us from any liability in connection with your use of, or reliance upon, the content or products found herein.