
|
Telus Corporation (TU): 5 Forces Analysis [Jan-2025 MISE À JOUR] |
Entièrement Modifiable: Adapté À Vos Besoins Dans Excel Ou Sheets
Conception Professionnelle: Modèles Fiables Et Conformes Aux Normes Du Secteur
Pré-Construits Pour Une Utilisation Rapide Et Efficace
Compatible MAC/PC, entièrement débloqué
Aucune Expertise N'Est Requise; Facile À Suivre
TELUS Corporation (TU) Bundle
Dans le monde dynamique des télécommunications canadiennes, Telus Corporation navigue dans un paysage complexe façonné par les cinq forces de Michael Porter. De lutter contre les concurrents féroces comme Rogers et Bell à la gestion des demandes évolutives des clients avertis en technologie, TELUS doit manœuvrer stratégiquement grâce aux défis de l'énergie des fournisseurs, des préférences des clients, des perturbations technologiques et des barrières d'entrée sur le marché. Cette analyse dévoile la dynamique compétitive complexe qui définit le positionnement stratégique de Telus dans un écosystème de télécommunications de plus en plus compétitif et axé sur la technologie.
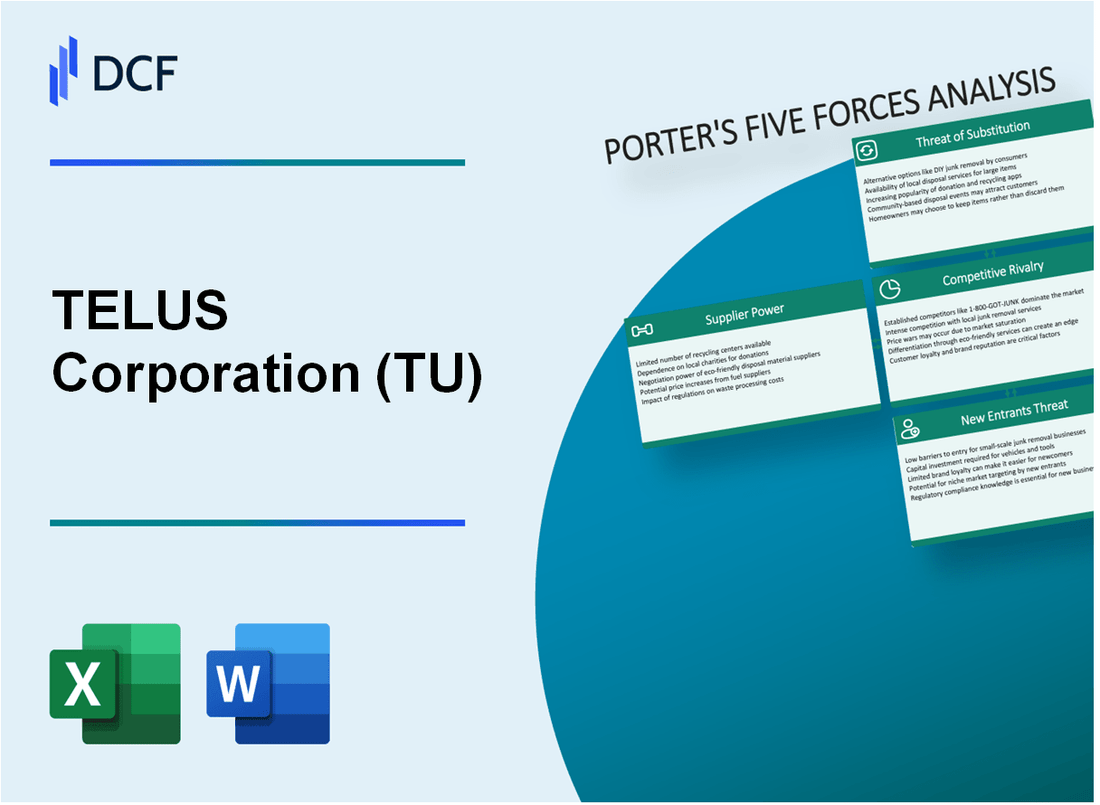
Telus Corporation (TU) - Five Forces de Porter: Pouvoir de négociation des fournisseurs
Fabricants d'équipements de réseau
TELUS s'appuie sur un nombre limité de fournisseurs d'équipements de réseau:
| Fournisseur | Part de marché | Revenus de 2023 |
|---|---|---|
| Systèmes Cisco | 39.4% | 51,6 milliards de dollars |
| Éricson | 27.3% | 24,8 milliards de dollars |
| Nokia | 22.1% | 22,3 milliards de dollars |
Exigences d'investissement en capital
Exigences de capital de l'infrastructure du réseau pour TELUS:
- Investissement d'infrastructure du réseau 5G: 1,3 milliard de dollars en 2023
- Total des dépenses d'équipement réseau: 687 millions de dollars
- Coûts de mise à niveau des infrastructures technologiques annuelles: 412 millions de dollars
Métriques de concentration des fournisseurs
| Métrique | Valeur |
|---|---|
| Nombre de fournisseurs d'équipements de télécommunications primaires | 3-4 fournisseurs mondiaux |
| Coûts de commutation des fournisseurs | 45 à 78 millions de dollars par transition |
| Durée du contrat moyen des fournisseurs | 4-6 ans |
Telus Corporation (TU) - Five Forces de Porter: Pouvoir de négociation des clients
Marché des télécommunications canadiennes hautement compétitives
Au quatrième trimestre 2023, le marché canadien des télécommunications est composé de trois principaux acteurs: Telus, Rogers et Bell, avec une rupture de part de marché comme suit:
| Fournisseur de télécommunications | Part de marché (%) |
|---|---|
| Rogers | 32.1% |
| Télus | 28.5% |
| Cloche | 27.9% |
Demande croissante des consommateurs de plans mobiles et Internet flexibles
Les préférences des consommateurs en 2023 indiquent des tendances importantes:
- 87% des consommateurs canadiens préfèrent les plans mobiles avec des données illimitées
- 62% des clients modifient les fournisseurs dans les 18 mois
- Le taux de commutation du plan mobile a augmenté de 14,3% en 2023
Augmentation de la sensibilité des prix parmi les clients
Mesures de sensibilité aux prix pour les services de télécommunications au Canada:
| Indicateur de sensibilité aux prix | Valeur |
|---|---|
| Coût du plan mobile mensuel moyen | $65.47 |
| Pourcentage disposé à changer pour 10% d'économies | 43% |
| Coût annuel d'acquisition des clients | 487 $ par client |
Options de substitution multiples dans les services de télécommunications
Options de substitution disponibles pour les consommateurs canadiens:
- Services VoIP: 42% de pénétration du marché
- Opérateurs de réseau virtuel mobile (MVNO): 7,3% de part de marché
- Plans mobiles prépayés: 16,5% du total des abonnements mobiles
Telus Corporation (TU) - Five Forces de Porter: rivalité compétitive
Concurrence sur le marché Overview
Au quatrième trimestre 2023, le marché canadien des télécommunications est dominé par trois principaux acteurs: Telus, Rogers et Bell.
| Concurrent | Part de marché (%) | Abonnés mobiles |
|---|---|---|
| Rogers | 32.1% | 10,8 millions |
| Cloche | 29.7% | 9,5 millions |
| Télus | 28.5% | 9,2 millions |
Dynamique des prix
Prix moyen mensuel du plan mobile au Canada pour 2024:
- Plans de données illimitées: 75 $ - 95 $
- Plans familiaux partagés: 120 $ - 150 $
- Plans prépayés: 40 $ à 60 $
Investissement en infrastructure
Investissement de l'infrastructure du réseau Telus pour 2023-2024:
| Catégorie d'investissement | Montant (CAD) |
|---|---|
| Extension du réseau 5G | 1,2 milliard de dollars |
| Réseau de fibre optique | 800 millions de dollars |
| Connectivité rurale | 350 millions de dollars |
Métriques du service client
Notes de satisfaction des clients de Telus pour 2023:
- Score du promoteur net: 68
- Taux de rétention de la clientèle: 87,5%
- Temps de résolution moyen: 24 heures
Telus Corporation (TU) - Five Forces de Porter: menace de substituts
Rising Popularité des plateformes de communication excessives
WhatsApp a déclaré que 2 milliards d'utilisateurs actifs mensuels dans le monde en 2023. Zoom communications vidéo a atteint 4,4 milliards de dollars de revenus en 2022. Skype comptait 300 millions d'utilisateurs actifs en 2023.
| Plate-forme | Utilisateurs actifs mensuels | Revenus annuels |
|---|---|---|
| 2 milliards | 0,85 milliard de dollars | |
| Zoom | 300 millions | 4,4 milliards de dollars |
| Skype | 300 millions | 2,3 milliards de dollars |
Adoption croissante de services de communication sur Internet
Le marché mondial de la communication sur Internet prévoyait de atteindre 294,9 milliards de dollars d'ici 2027. Le marché VoIP mobile devrait augmenter à 21,5% du TCAC entre 2022-2030.
- Taille du marché Webbrtc estimé à 2,7 milliards de dollars en 2022
- Marché mondial de la téléphonie Internet d'une valeur de 102,3 milliards de dollars en 2023
- Marché de la plate-forme de communication cloud prévoyant pour atteindre 36,45 milliards de dollars d'ici 2026
Émergence d'opérateurs de réseau virtuel mobile
MVNO Market d'une valeur de 73,7 milliards de dollars en 2022. Projeté pour atteindre 142,8 milliards de dollars d'ici 2030 avec un TCAC de 20,3%.
| Segment MVNO | Valeur marchande 2022 | Valeur marchande projetée 2030 |
|---|---|---|
| Marché mondial MVNO | 73,7 milliards de dollars | 142,8 milliards de dollars |
Solutions de connectivité alternatives croissantes
Le marché mondial Wi-Fi devrait atteindre 72,2 milliards de dollars d'ici 2028. Le marché Internet satellite prévu à 18,3 milliards de dollars d'ici 2027.
- Marché d'accès sans fil fixe 5G estimé à 4,7 milliards de dollars en 2022
- Les abonnés à Internet satellite devraient atteindre 3,1 millions d'ici 2024
- Le marché mondial du Wi-Fi public augmente à 14,2% de TCAC
Telus Corporation (TU) - Five Forces de Porter: menace de nouveaux entrants
Exigences de capital élevé pour l'infrastructure du réseau
Telus a investi 1,7 milliard de dollars dans les dépenses en capital en 2022 pour le développement des infrastructures réseau. Le déploiement du réseau 5G coûte environ 3,5 millions de dollars par kilomètre carré dans les zones urbaines.
| Catégorie d'investissement dans l'infrastructure | Coût annuel (CAO) |
|---|---|
| Équipement réseau | 742 millions de dollars |
| Expansion de la fibre optique | 456 millions de dollars |
| Installation de la tour 5G | 312 millions de dollars |
Barrières réglementaires dans le secteur des télécommunications canadiennes
La Commission canadienne de la radio-télévision et des télécommunications (CRTC) impose des réglementations strictes sur l'entrée sur le marché.
- Les frais d'entrée aux enchères du spectre varient de 50 millions de dollars à 500 millions de dollars
- Exigences obligatoires de propriété canadienne de 80% pour les fournisseurs de télécommunications
- Coûts de conformité estimés à 12,3 millions de dollars par an pour les nouveaux entrants
Coûts de licence de spectre significatif
2021 Les enchères Spectrum ont généré 8,9 milliards de dollars de revenus totaux de licence pour le gouvernement canadien.
| Bande de spectre | Coût de licence |
|---|---|
| 3500 MHz | 2,1 milliards de dollars |
| mmwave | 627 millions de dollars |
Fidélité à la marque établie des fournisseurs de télécommunications sortants
Telus maintient une part de marché de 33,5% dans les télécommunications sans fil canadiennes avec 9,8 millions d'abonnés mobiles au T2 2022.
- Taux de rétention de la clientèle: 87,2%
- Revenu moyen par utilisateur (ARPU): 68,43 $ par mois
- Indice de fidélité de la marque: 4,2 sur 5
TELUS Corporation (TU) - Porter's Five Forces: Competitive rivalry
You're looking at a market where the established players fight tooth and nail for every subscriber. Honestly, the competitive rivalry in core Canadian telecom is, and remains, extremely high. Rogers Communications Inc., BCE Inc., and TELUS Corporation collectively held roughly 90% of wireless revenue as of 2024. Even when you look at the top four providers including Quebecor Group, they still accounted for 85.6% of total telecommunications service revenues in 2023.
This intensity shows up directly in your wallet, or rather, the company's average revenue per user (ARPU). For instance, TELUS's mobile phone ARPU in the first quarter of 2025 settled at $57.13. That was a drop of $2.18, or 3.7 per cent, compared to the year prior. The reason? Customers are signing up for base rate plans due to what the CEO called "more intense marketing and promotional price competition."
The CEO, Darren Entwistle, has been quite vocal about this dynamic. He decried a culture of price-matching in the industry, questioning why TELUS must always match prices in a 'race to the bottom.' The aggressive pricing from the fourth national carrier, Quebecor-owned Freedom Mobile, catalyzed an 18.2% national average decline in wireless tariffs during 2023 alone, forcing incumbents to shift focus. Still, TELUS is signaling a strategic pivot away from pure price wars.
Here's the quick math on how TELUS is balancing growth against profitability in this environment. The company is targeting profitable growth over market share at any cost, as evidenced by its guidance.
| Metric (TTech, incl. Health) | 2025 Target Range | Q3 2025 Actual Growth |
|---|---|---|
| Operating Revenues Growth | 2 to 4 per cent | Expected to be at the lower end of the original range |
| Adjusted EBITDA Growth | 3 to 5 per cent | 3 per cent |
This focus on margin-accretive growth is key, especially as TELUS Health continues to scale rapidly. The rivalry isn't just about the core connectivity business anymore. TELUS Health is executing its global growth strategy, delivering Operating Revenue growth of 18 per cent and Adjusted EBITDA growth of 24 per cent in the third quarter of 2025. That's a clear example of the rivalry extending into non-traditional, high-growth areas like health services.
The competitive pressures in the core business are being managed through operational discipline and synergy realization. For example, TELUS achieved $355 million in combined annualized synergies following the LifeWorks acquisition, and they remain on track to hit the $427 million goal by the end of 2025. This internal efficiency helps offset external pricing pressure.
Key competitive dynamics you need to watch:
- Wireless tariff pressure is easing slightly, with Q3 2025 Mobility network revenue growth described as stable.
- The push for premium service differentiation over price parity is the stated strategic goal.
- TELUS Health's 24 per cent Adjusted EBITDA growth in Q3 2025 shows success in non-core segments.
- The top three incumbents control about 90% of wireless revenue, showing high barriers to entry.
- The company is committed to its dividend growth program, targeting 3 to 8 per cent annual growth through 2028.
Finance: model the impact of achieving the low end (3%) versus the high end (5%) of the 2025 TTech Adjusted EBITDA target on the Q4 2025 dividend coverage ratio by next Tuesday.
TELUS Corporation (TU) - Porter's Five Forces: Threat of substitutes
The threat of substitutes for TELUS Corporation remains a significant pressure point, primarily driven by Over-The-Top (OTT) services that directly compete with traditional communication and entertainment offerings. This threat is best characterized as moderate and rising, especially in the video and voice segments.
Internet-based communication apps are actively substituting traditional revenue streams like SMS and voice calls. The persistent decline in fixed voice revenue is a clear indicator of this substitution effect. For instance, in the third quarter of 2025, fixed voice services revenues at TELUS Corporation fell by $12 million, representing a 7 per cent decrease year-over-year. This follows a similar trend seen in the fourth quarter of 2024, where fixed voice services revenues decreased by $15 million, or 8.0 per cent.
The television segment faces a similar substitution challenge. Lower TV revenue per customer is directly linked to customers selecting smaller TV combination packages and the broader technological substitution away from traditional cable/satellite. This trend is evident in the broader Canadian market where Canadian cable, satellite and Telco TV subscription revenue declined by five per cent to $6.51 billion in 2024. Conversely, the substitute, Canadian OTT subscription revenue, grew 15 per cent to reach $4.2 billion in 2024 and is forecast to leap another 15 per cent to $4.85 billion in 2025.
You can see the direct impact of this substitution on traditional services here:
| Metric | Period | Value/Change | Source Context |
|---|---|---|---|
| Fixed Voice Services Revenue Decrease | Q3 2025 | $12 million (7 per cent) | Reflecting ongoing decline due to technological substitution |
| Fixed Voice Services Revenue Decrease | Q4 2024 | $15 million (8.0 per cent) | Reflecting ongoing decline due to technological substitution |
| Canadian Cable, Satellite, Telco TV Subscription Revenue | 2024 | Declined 5 per cent to $6.51 billion | Similar declines forecast through 2027 |
| Canadian OTT Subscription Revenue | 2025 (Forecast) | Forecast to reach $4.85 billion | Represents a 15 per cent leap from 2024 |
| Households Without Telco TV Subscription | End of 2024 | 7.35 million (46 per cent) | Did not have cable, satellite or Telco TV access |
TELUS Corporation actively mitigates this threat by bundling services and investing heavily in its own digital segments. The growth in TELUS Digital operating revenues shows this strategic pivot in action. For example, in the third quarter of 2025, TELUS Digital operating revenues increased by $33 million, or 5 per cent. This growth was also seen in the second quarter of 2025, with revenues up $56 million or 8 per cent. Furthermore, the adoption of TELUS Digital's solutions across TTech operations is cited as a factor contributing to competitive benefits and TTech Adjusted EBITDA growth.
The ongoing shift means that the traditional fixed voice business is shrinking, but the company is finding growth in data and digital:
- TELUS Digital operating revenues increased by $27 million or 4 per cent in Q1 2025.
- TELUS Digital operating revenues increased by $56 million or 8 per cent in Q2 2025.
- TELUS Digital operating revenues increased by $33 million or 5 per cent in Q3 2025.
- The company's focus on bundling helps preserve the average revenue per account despite OTT pressures.
- The company is leveraging its PureFibre network and leading portfolio of bundled services to drive internet customer additions.
TELUS Corporation (TU) - Porter's Five Forces: Threat of new entrants
You're assessing the competitive landscape for TELUS Corporation, and the threat of new entrants is definitely low. Honestly, the sheer scale of investment required to even attempt to compete nationally acts as a massive moat around the incumbents.
The barrier to entry is primarily rooted in the massive capital requirements for building out a national, modern telecommunications network. Consider TELUS Corporation's own guidance: their 2025 capital expenditure target is set at approximately $2.5 billion, excluding real estate initiatives. That's the level of annual spending required just for an established player to maintain and upgrade its network; a new entrant would need to match or exceed this just to get to parity, which is a staggering initial hurdle.
This capital intensity is further underscored by the historical spending on necessary radio assets. To be fair, a new entrant doesn't just need to build towers; they need the airwaves to transmit signals. The incumbents have already spent fortunes securing this scarce resource.
| Spectrum Auction Year | Amount Invested (Billions/Millions USD) | Frequency Band |
|---|---|---|
| 1999 | $171.8 million | 24 GHz and 38 GHz |
| 2008 | $4.3 billion | AWS-1 |
| 2014 | $5.3 billion | MBS (700MHz) |
| 2019 | $3.5 billion | 600MHz |
| 2021 | $8.9 billion | 3500MHz |
| 2023 | $2.2 billion | 3800MHz |
Wireless network operators in Canada have invested nearly $29 billion in acquiring spectrum licenses through government-held auctions from 1999 through 2024. This historical investment alone represents sunk costs that a new entrant would have to match or exceed in future auctions, plus the annual license fees.
Also, significant regulatory hurdles create a high barrier. The need to acquire scarce wireless spectrum licenses is a major roadblock. While the cost of acquiring the license is the upfront auction price, the ongoing cost of use is also regulated. Innovation, Science and Economic Development Canada (ISED) announced a new fee structure in March 2025, set to take effect for the 2026-27 fiscal year, which is designed to make national carriers like TELUS Corporation pay a greater share of the total industry fees. This regulatory environment, which prices spectrum based on market value rather than just cost recovery, makes entry expensive and predictable only through government policy changes.
Entrants struggle against the incumbents' fully built-out infrastructure. TELUS Corporation, for example, has been aggressively deploying its network assets. By May 2024, the company had already connected more than 1.9 million homes and businesses in British Columbia with TELUS PureFibre. Furthermore, TELUS Corporation has a total national commitment of $73 billion across Canada through 2028 for network development.
You can see the scale of the incumbent advantage here:
- TELUS Corporation's commitment to deploy $73 billion across Canada through 2028.
- The company's 2025 CapEx target is $2.5 billion.
- The total historical spectrum auction spend by incumbents is nearly $29 billion since 1999.
- TELUS Corporation is continuing to expand its 5G network using advanced technology like ORAN.
A new competitor faces the prospect of building a competing national fibre and 5G network from scratch while simultaneously bidding billions in future spectrum auctions. That's a tough proposition.
Disclaimer
All information, articles, and product details provided on this website are for general informational and educational purposes only. We do not claim any ownership over, nor do we intend to infringe upon, any trademarks, copyrights, logos, brand names, or other intellectual property mentioned or depicted on this site. Such intellectual property remains the property of its respective owners, and any references here are made solely for identification or informational purposes, without implying any affiliation, endorsement, or partnership.
We make no representations or warranties, express or implied, regarding the accuracy, completeness, or suitability of any content or products presented. Nothing on this website should be construed as legal, tax, investment, financial, medical, or other professional advice. In addition, no part of this site—including articles or product references—constitutes a solicitation, recommendation, endorsement, advertisement, or offer to buy or sell any securities, franchises, or other financial instruments, particularly in jurisdictions where such activity would be unlawful.
All content is of a general nature and may not address the specific circumstances of any individual or entity. It is not a substitute for professional advice or services. Any actions you take based on the information provided here are strictly at your own risk. You accept full responsibility for any decisions or outcomes arising from your use of this website and agree to release us from any liability in connection with your use of, or reliance upon, the content or products found herein.