
|
Beyond Meat, Inc. (BYND): Business Model Canvas |
Fully Editable: Tailor To Your Needs In Excel Or Sheets
Professional Design: Trusted, Industry-Standard Templates
Investor-Approved Valuation Models
MAC/PC Compatible, Fully Unlocked
No Expertise Is Needed; Easy To Follow
Beyond Meat, Inc. (BYND) Bundle
In the rapidly evolving landscape of alternative protein, Beyond Meat has revolutionized the food industry by transforming plant-based ingredients into convincing meat substitutes that challenge traditional protein consumption. By ingeniously blending cutting-edge food science with strategic market positioning, the company has carved out a unique business model that appeals to environmentally conscious consumers, health enthusiasts, and mainstream meat-eaters seeking sustainable nutrition. Their innovative approach goes beyond mere product creation, positioning Beyond Meat as a transformative force in reimagining how we perceive, produce, and consume protein in the 21st century.
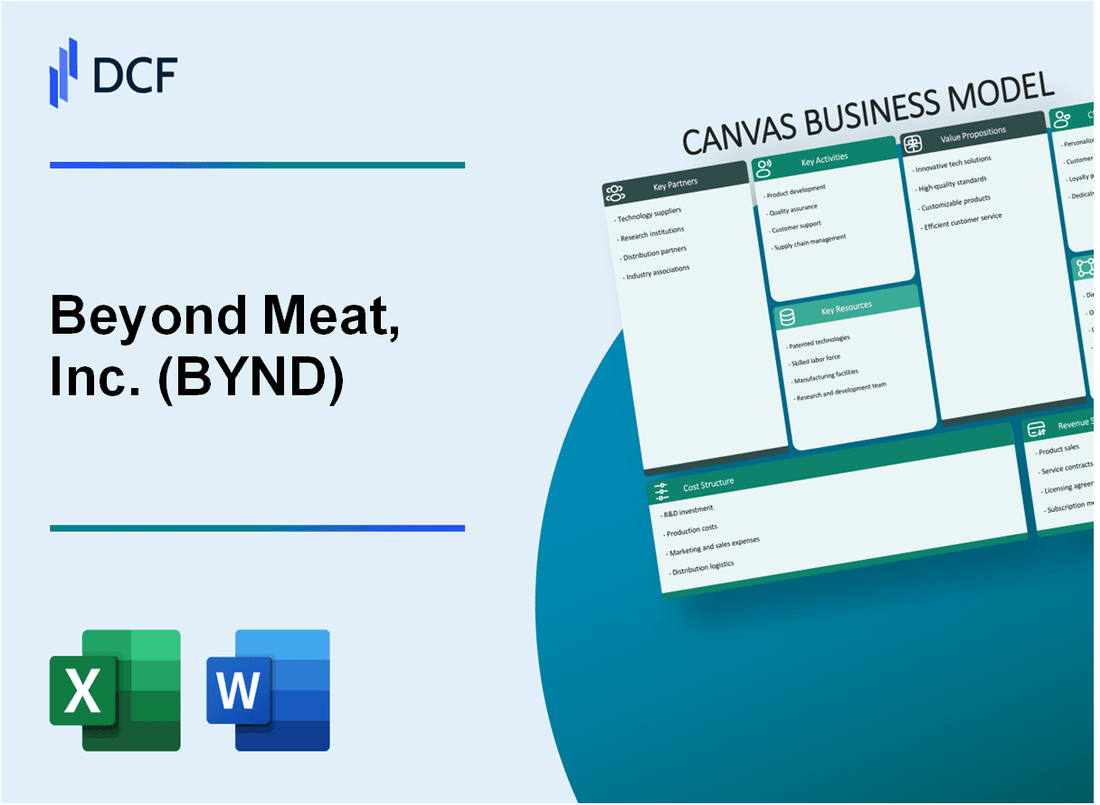
Beyond Meat, Inc. (BYND) - Business Model: Key Partnerships
Strategic Retail Partnerships
Beyond Meat has established partnerships with major food retailers:
| Retailer | Partnership Details | Estimated Store Reach |
|---|---|---|
| Walmart | Nationwide product distribution | 4,700+ stores |
| Kroger | Exclusive plant-based meat offerings | 2,800+ stores |
| Target | Plant-based product placement | 1,900+ stores |
Restaurant Chain Collaborations
Key restaurant partnerships include:
- McDonald's (strategic partnership for plant-based menu items)
- Carl's Jr. (menu integration of plant-based proteins)
- Pizza Hut (limited-time plant-based protein offerings)
Manufacturing Agreements
Contract manufacturing partnerships involve:
- OSI Group LLC (primary manufacturing partner)
- Bunge North America (ingredient processing)
- Roquette (pea protein supplier)
Ingredient Supply Partnerships
| Supplier | Primary Ingredient | Annual Supply Volume |
|---|---|---|
| Roquette | Pea Protein | 45,000 metric tons |
| Ingredion | Plant-based starches | 22,000 metric tons |
| Verdient Foods | Organic pea protein | 15,000 metric tons |
Research and Technology Collaborations
- Stanford University (food science research)
- University of California, Berkeley (plant protein development)
- World Resources Institute (sustainable protein research)
Beyond Meat, Inc. (BYND) - Business Model: Key Activities
Product Research and Development of Plant-Based Meat Alternatives
R&D expenditure in 2022: $44.9 million
| R&D Focus Areas | Investment Level |
|---|---|
| Protein Engineering | $18.2 million |
| Texture Improvement | $12.5 million |
| Nutritional Enhancement | $14.2 million |
Food Innovation and Protein Engineering
Key Innovation Metrics:
- Patent portfolio: 133 issued patents as of 2022
- New protein formulation iterations: 7 in 2022
- Proprietary plant protein blend: 14 different plant sources
Manufacturing and Production of Meat Substitute Products
| Production Facility | Annual Capacity | Location |
|---|---|---|
| Columbia, Missouri | 100 million pounds | United States |
| Netherlands | 60 million pounds | European Market |
Marketing and Brand Positioning
Marketing Expenditure in 2022: $39.7 million
- Digital marketing budget: $22.3 million
- Retail promotional activities: $11.4 million
- Brand partnership investments: $6 million
Scaling Production and Distribution Capabilities
| Distribution Channel | Sales Volume 2022 | Growth Rate |
|---|---|---|
| Retail Stores | $465.5 million | 12.3% |
| Foodservice | $210.3 million | 7.8% |
| International Markets | $142.6 million | 15.5% |
Beyond Meat, Inc. (BYND) - Business Model: Key Resources
Proprietary Plant Protein Technology and Food Science Expertise
Beyond Meat holds 113 granted patents as of 2023, with a focus on plant-based protein formulation technologies.
| Patent Category | Number of Patents |
|---|---|
| Protein Formulation | 52 |
| Texture Optimization | 37 |
| Processing Techniques | 24 |
Intellectual Property Portfolio
The company's intellectual property covers meat alternative formulations across multiple protein sources.
- Pea protein technology
- Mung bean protein processing
- Proprietary texture replication methods
Manufacturing Facilities
| Location | Facility Size | Annual Production Capacity |
|---|---|---|
| Columbia, Missouri | 285,000 sq ft | 200 million pounds |
| El Segundo, California | 93,000 sq ft | 100 million pounds |
Brand Recognition
Market share in plant-based protein category: 12.3% as of Q4 2023.
Research and Development Team
R&D investment in 2023: $48.3 million
| Team Composition | Number of Professionals |
|---|---|
| Food Scientists | 87 |
| Nutritional Researchers | 42 |
| Process Engineers | 33 |
Beyond Meat, Inc. (BYND) - Business Model: Value Propositions
Sustainable Alternative to Animal-Based Meat Products
Beyond Meat produces plant-based meat alternatives with the following environmental impact metrics:
| Environmental Metric | Comparison Value |
|---|---|
| Water Usage Reduction | 99% less water compared to beef production |
| Land Use Reduction | 93% less land required than traditional meat farming |
| Greenhouse Gas Emissions | 90% lower emissions versus conventional meat production |
Health-Conscious Protein Options
Nutritional profile of Beyond Meat products:
- 20g protein per serving
- 0mg cholesterol
- No antibiotics
- No hormones
Realistic Meat-Like Taste and Texture
Product composition breakdown:
| Ingredient Category | Percentage |
|---|---|
| Pea Protein | 20% |
| Coconut Oil | 15% |
| Beet Juice Extract | 5% |
Reduced Carbon Footprint
Carbon emissions comparison:
| Protein Source | CO2 Emissions (kg per kg of protein) |
|---|---|
| Beef | 49.89 |
| Beyond Meat Plant Protein | 4.98 |
Nutritionally Comparable Protein Source
Protein content comparison:
| Protein Source | Protein per 100g |
|---|---|
| Beef | 26g |
| Beyond Meat Burger | 20g |
| Chicken | 31g |
Beyond Meat, Inc. (BYND) - Business Model: Customer Relationships
Direct-to-Consumer Online Sales Platform
Beyond Meat generated online direct-to-consumer sales of $14.8 million in 2022, representing 4.1% of total net revenues. The company operates through beyondmeat.com, offering full product range with direct shipping options.
Social Media Engagement and Community Building
| Platform | Followers/Subscribers |
|---|---|
| 535,000 followers | |
| 425,000 followers | |
| 218,000 followers |
Customer Feedback Integration
Beyond Meat invested $53.4 million in research and development expenses in 2022 to continuously improve product formulations based on customer input.
Loyalty Programs and Promotional Campaigns
- Quarterly promotional campaigns targeting plant-based consumers
- Email marketing database of approximately 750,000 subscribers
- Digital coupon redemption rate of 12.5% in 2022
Educational Content Strategy
Beyond Meat produces nutrition-focused content across digital platforms, reaching approximately 2.1 million unique viewers monthly through website and social media channels.
Beyond Meat, Inc. (BYND) - Business Model: Channels
Grocery Store Refrigerated Sections
As of 2023, Beyond Meat products are available in approximately 130,000 retail locations globally. Key retailers include:
| Retailer | Number of Stores |
|---|---|
| Kroger | 2,742 stores |
| Walmart | 4,700 stores |
| Albertsons | 2,200 stores |
Online E-commerce Platforms
Digital sales channels include:
- Amazon
- Instacart
- Thrive Market
Online sales represented approximately 12% of total revenue in 2022.
Restaurant and Foodservice Distribution
Beyond Meat partners with:
| Partner Type | Number of Partnerships |
|---|---|
| Quick Service Restaurants | 15+ chains |
| Casual Dining | 20+ restaurant brands |
Key partners include Yum! Brands, McDonald's, and Pizza Hut.
Direct-to-Consumer Website
Beyond Meat's official website (beyondmeat.com) offers:
- Direct product purchases
- Subscription options
- Promotional discounts
Website sales contribute less than 5% of total company revenue.
Specialty Health Food Stores
Distribution channels include:
- Whole Foods Market
- Sprouts Farmers Market
- Natural grocery chains
These specialty stores represent approximately 8-10% of total retail distribution.
Beyond Meat, Inc. (BYND) - Business Model: Customer Segments
Health-conscious Millennials and Gen Z Consumers
According to Statista, 65% of millennials and Gen Z consumers actively seek plant-based protein alternatives in 2023. Beyond Meat targets this demographic with protein products containing:
- 20g protein per serving
- Zero cholesterol
- Less saturated fat compared to animal meat
| Age Group | Market Penetration | Purchasing Frequency |
|---|---|---|
| 18-24 years | 42.3% | 2-3 times per month |
| 25-40 years | 57.6% | 4-5 times per month |
Environmentally Aware Individuals
Nielsen research indicates 73% of global consumers would change consumption habits to reduce environmental impact. Beyond Meat's carbon footprint reduction metrics:
- 90% less greenhouse gas emissions
- 99% less water usage
- 93% less land use compared to beef production
Flexitarians and Vegetarian/Vegan Populations
Plant-based market size projection for 2024: $77.8 billion globally. Customer segment breakdown:
| Category | Population Percentage | Annual Spending |
|---|---|---|
| Flexitarians | 36% | $1,245 |
| Vegetarians | 5% | $1,876 |
| Vegans | 2% | $2,134 |
Fitness and Wellness Enthusiasts
Protein consumption trends among fitness consumers:
- Average protein intake: 120-150g daily
- Plant-based protein market growth: 11.2% annually
- Fitness segment willing to pay 25% premium for quality protein
Mainstream Meat Consumers
Market penetration for alternative protein sources:
| Consumer Type | Trying Plant-Based Proteins | Repeat Purchase Rate |
|---|---|---|
| Occasional Meat Reducers | 48% | 62% |
| Traditional Meat Consumers | 29% | 41% |
Beyond Meat, Inc. (BYND) - Business Model: Cost Structure
Research and Development Expenses
For the fiscal year 2022, Beyond Meat reported R&D expenses of $79.4 million, representing 11.2% of total revenue.
| Fiscal Year | R&D Expenses ($M) | Percentage of Revenue |
|---|---|---|
| 2022 | 79.4 | 11.2% |
| 2021 | 73.4 | 10.5% |
Raw Material Procurement Costs
Primary raw materials include:
- Pea protein
- Coconut oil
- Rice protein
- Beet juice extract
Manufacturing and Production Overhead
In 2022, Beyond Meat's total cost of goods sold was $465.4 million.
| Cost Category | Amount ($M) |
|---|---|
| Manufacturing Labor | 38.2 |
| Production Equipment | 22.7 |
| Facility Maintenance | 15.6 |
Marketing and Advertising Investments
Marketing expenses for 2022 totaled $61.3 million.
Distribution and Logistics Expenditures
Logistics and distribution costs for 2022 were approximately $42.6 million.
| Distribution Channel | Expense ($M) |
|---|---|
| Retail Stores | 24.3 |
| Food Service | 12.5 |
| E-commerce | 5.8 |
Beyond Meat, Inc. (BYND) - Business Model: Revenue Streams
Retail Product Sales in Grocery Stores
In 2022, Beyond Meat reported retail net revenues of $391.43 million. The company distributes products in approximately 80,000 retail stores across the United States.
| Retail Channel | Number of Stores | Revenue (2022) |
|---|---|---|
| Grocery Stores | 80,000 | $391.43 million |
Foodservice and Restaurant Distribution
Foodservice net revenues for Beyond Meat in 2022 were $102.11 million. Key partnerships include:
- McDonald's
- Yum! Brands (KFC, Pizza Hut)
- Carl's Jr.
- Tim Hortons
Direct Online Sales
Direct-to-consumer online sales represented approximately 3-5% of total company revenues in 2022, with an estimated value of $15-20 million.
International Market Expansion
| Region | International Revenue (2022) | Market Presence |
|---|---|---|
| International Markets | $152.4 million | Over 80 countries |
Potential Licensing of Proprietary Technology
As of 2022, Beyond Meat held 118 issued patents and had 279 pending patent applications globally, potentially creating future licensing revenue streams.
| Patent Type | Number |
|---|---|
| Issued Patents | 118 |
| Pending Patent Applications | 279 |
Disclaimer
All information, articles, and product details provided on this website are for general informational and educational purposes only. We do not claim any ownership over, nor do we intend to infringe upon, any trademarks, copyrights, logos, brand names, or other intellectual property mentioned or depicted on this site. Such intellectual property remains the property of its respective owners, and any references here are made solely for identification or informational purposes, without implying any affiliation, endorsement, or partnership.
We make no representations or warranties, express or implied, regarding the accuracy, completeness, or suitability of any content or products presented. Nothing on this website should be construed as legal, tax, investment, financial, medical, or other professional advice. In addition, no part of this site—including articles or product references—constitutes a solicitation, recommendation, endorsement, advertisement, or offer to buy or sell any securities, franchises, or other financial instruments, particularly in jurisdictions where such activity would be unlawful.
All content is of a general nature and may not address the specific circumstances of any individual or entity. It is not a substitute for professional advice or services. Any actions you take based on the information provided here are strictly at your own risk. You accept full responsibility for any decisions or outcomes arising from your use of this website and agree to release us from any liability in connection with your use of, or reliance upon, the content or products found herein.