
|
Beim Halten von AG (Onon) DCF -Bewertung |
Fully Editable: Tailor To Your Needs In Excel Or Sheets
Professional Design: Trusted, Industry-Standard Templates
Investor-Approved Valuation Models
MAC/PC Compatible, Fully Unlocked
No Expertise Is Needed; Easy To Follow
On Holding AG (ONON) Bundle
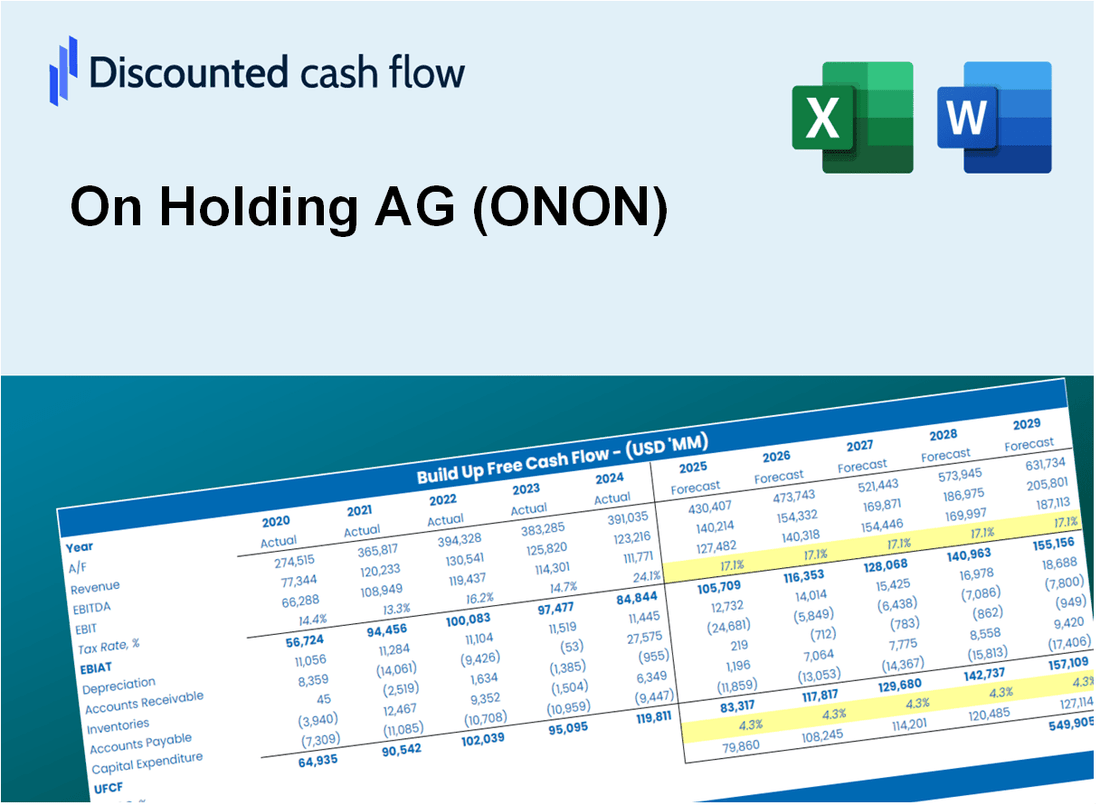
Bönen Sie die Bewertung der AG (Onon) mit diesem anpassbaren DCF -Taschenrechner ein! Mit Real on Holding AG (Onon) Finanzdaten und einstellbaren Prognoseeingaben können Sie verschiedene Szenarien untersuchen und feststellen, dass der Fair -Wert der AG (ONON) in nur wenigen Minuten die Holding AG (ONON).
What You Will Get
- Real ONON Financial Data: Pre-filled with On Holding AG’s historical and projected data for precise analysis.
- Fully Editable Template: Modify key inputs like revenue growth, WACC, and EBITDA % with ease.
- Automatic Calculations: See On Holding AG’s intrinsic value update instantly based on your changes.
- Professional Valuation Tool: Designed for investors, analysts, and consultants seeking accurate DCF results.
- User-Friendly Design: Simple structure and clear instructions for all experience levels.
Key Features
- 🔍 Real-Life ONON Financials: Pre-filled historical and projected data for On Holding AG.
- ✏️ Fully Customizable Inputs: Adjust all critical parameters (yellow cells) like WACC, growth %, and tax rates.
- 📊 Professional DCF Valuation: Built-in formulas calculate On Holding’s intrinsic value using the Discounted Cash Flow method.
- ⚡ Instant Results: Visualize On Holding’s valuation instantly after making changes.
- Scenario Analysis: Test and compare outcomes for various financial assumptions side-by-side.
How It Works
- Download the Template: Get instant access to the Excel-based ONON DCF Calculator.
- Input Your Assumptions: Adjust yellow-highlighted cells for growth rates, WACC, margins, and more.
- Instant Calculations: The model automatically updates On Holding AG’s intrinsic value.
- Test Scenarios: Simulate different assumptions to evaluate potential valuation changes.
- Analyze and Decide: Use the results to guide your investment or financial analysis.
Why Choose This Calculator for On Holding AG (ONON)?
- Accurate Data: Utilize real On Holding AG financials for dependable valuation outcomes.
- Customizable: Tailor essential parameters like growth rates, WACC, and tax rates to fit your forecasts.
- Time-Saving: Pre-configured calculations save you the hassle of starting from the ground up.
- Professional-Grade Tool: Crafted for investors, analysts, and consultants in the field.
- User-Friendly: A straightforward design and guided instructions make it accessible for all users.
Who Should Use This Product?
- Investors: Gain insights and make informed decisions with a premium valuation tool tailored for (ONON).
- Financial Analysts: Streamline your analysis process with a customizable DCF model designed specifically for (ONON).
- Consultants: Effortlessly modify the template for impactful client presentations or detailed reports on (ONON).
- Finance Enthusiasts: Enhance your knowledge of valuation methods through practical, real-world examples related to (ONON).
- Educators and Students: Utilize it as an effective educational resource in finance courses focusing on (ONON).
What the Template Contains
- Comprehensive DCF Model: Editable template featuring detailed valuation calculations tailored for On Holding AG (ONON).
- Real-World Data: On Holding AG's historical and projected financials preloaded for in-depth analysis.
- Customizable Parameters: Modify WACC, growth rates, and tax assumptions to explore various scenarios.
- Financial Statements: Complete annual and quarterly breakdowns for enhanced insights into performance.
- Key Ratios: Integrated analysis for assessing profitability, efficiency, and leverage metrics.
- Dashboard with Visual Outputs: Engaging charts and tables to present clear, actionable results.
Disclaimer
All information, articles, and product details provided on this website are for general informational and educational purposes only. We do not claim any ownership over, nor do we intend to infringe upon, any trademarks, copyrights, logos, brand names, or other intellectual property mentioned or depicted on this site. Such intellectual property remains the property of its respective owners, and any references here are made solely for identification or informational purposes, without implying any affiliation, endorsement, or partnership.
We make no representations or warranties, express or implied, regarding the accuracy, completeness, or suitability of any content or products presented. Nothing on this website should be construed as legal, tax, investment, financial, medical, or other professional advice. In addition, no part of this site—including articles or product references—constitutes a solicitation, recommendation, endorsement, advertisement, or offer to buy or sell any securities, franchises, or other financial instruments, particularly in jurisdictions where such activity would be unlawful.
All content is of a general nature and may not address the specific circumstances of any individual or entity. It is not a substitute for professional advice or services. Any actions you take based on the information provided here are strictly at your own risk. You accept full responsibility for any decisions or outcomes arising from your use of this website and agree to release us from any liability in connection with your use of, or reliance upon, the content or products found herein.