
|
Zillow Group, Inc. (Z) DCF -Bewertung |
Fully Editable: Tailor To Your Needs In Excel Or Sheets
Professional Design: Trusted, Industry-Standard Templates
Investor-Approved Valuation Models
MAC/PC Compatible, Fully Unlocked
No Expertise Is Needed; Easy To Follow
Zillow Group, Inc. (Z) Bundle
Vereinfachen Sie die Bewertung der Zillow Group, Inc. (Z) mit diesem anpassbaren DCF -Taschenrechner! Mit Real Zillow Group, Inc. (Z) Finanzdaten und einstellbaren Prognoseeingaben können Sie Szenarien testen und Zillow Group, Inc. (Z) Fair -Wert in Minuten aufdecken.
What You Will Receive
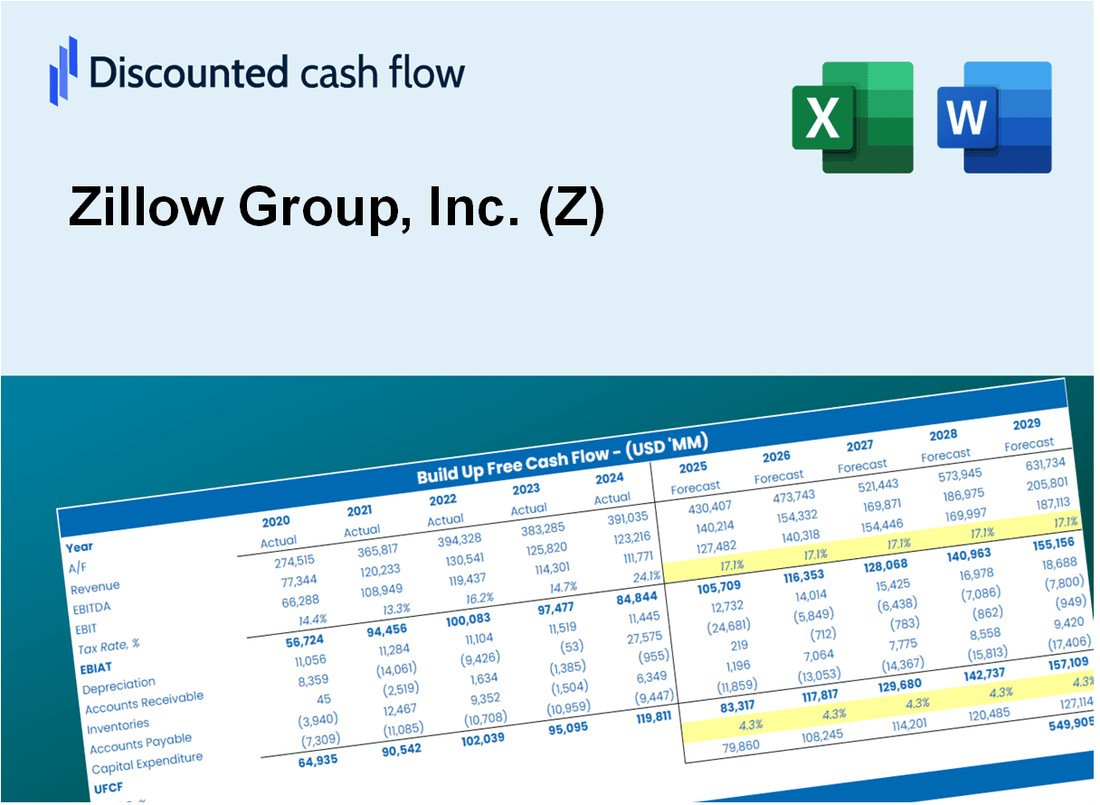
- Pre-Filled Financial Model: Zillow Group's actual data facilitates accurate DCF valuation.
- Comprehensive Forecast Control: Modify revenue growth, profit margins, WACC, and other essential drivers.
- Real-Time Calculations: Automatic updates ensure you view results instantly as adjustments are made.
- Investor-Ready Template: A polished Excel file crafted for high-quality valuation presentations.
- Customizable and Reusable: Designed for adaptability, allowing for repeated use in detailed forecasting.
Key Features
- Comprehensive Data: Zillow Group, Inc.'s historical performance metrics and pre-filled projections.
- Customizable Parameters: Modify WACC, tax rates, revenue growth, and EBITDA margins as needed.
- Real-Time Insights: Watch Zillow's intrinsic value update instantly with changes.
- Intuitive Visualizations: Dashboard graphs illustrate valuation outcomes and essential indicators.
- Designed for Precision: A robust resource for analysts, investors, and finance professionals.
How It Works
- Step 1: Download the prebuilt Excel template featuring Zillow Group, Inc.'s (Z) data.
- Step 2: Review the pre-filled sheets to familiarize yourself with the essential metrics.
- Step 3: Modify forecasts and assumptions in the editable yellow cells (WACC, growth, margins).
- Step 4: Instantly see the recalculated results, including Zillow Group, Inc.'s (Z) intrinsic value.
- Step 5: Use the outputs to make informed investment choices or create detailed reports.
Why Choose This Calculator?
- Designed for Real Estate Professionals: A sophisticated tool utilized by analysts, investors, and real estate consultants.
- Comprehensive Market Data: Zillow’s historical and projected property data preloaded for precision.
- Scenario Analysis: Effortlessly simulate various market conditions and investment strategies.
- Clear Insights: Automatically calculates property values, ROI, and critical metrics.
- User-Friendly: Step-by-step guidance makes navigation simple and intuitive.
Who Should Use This Product?
- Investors: Accurately assess Zillow Group, Inc.'s (Z) fair value before making investment decisions.
- CFOs: Utilize a professional-grade DCF model for financial reporting and analysis related to Zillow Group, Inc. (Z).
- Consultants: Quickly customize the template for valuation reports tailored to Zillow Group, Inc. (Z) clients.
- Entrepreneurs: Gain insights into financial modeling practices employed by leading real estate companies like Zillow Group, Inc. (Z).
- Educators: Use it as a teaching resource to illustrate valuation methodologies relevant to Zillow Group, Inc. (Z).
What the Template Contains
- Preloaded Z Data: Historical and projected financial data, including revenue, EBIT, and capital expenditures.
- DCF and WACC Models: Professional-grade sheets for calculating intrinsic value and Weighted Average Cost of Capital.
- Editable Inputs: Yellow-highlighted cells for adjusting revenue growth, tax rates, and discount rates.
- Financial Statements: Comprehensive annual and quarterly financials for deeper analysis.
- Key Ratios: Profitability, leverage, and efficiency ratios to evaluate performance.
- Dashboard and Charts: Visual summaries of valuation outcomes and assumptions.
Disclaimer
All information, articles, and product details provided on this website are for general informational and educational purposes only. We do not claim any ownership over, nor do we intend to infringe upon, any trademarks, copyrights, logos, brand names, or other intellectual property mentioned or depicted on this site. Such intellectual property remains the property of its respective owners, and any references here are made solely for identification or informational purposes, without implying any affiliation, endorsement, or partnership.
We make no representations or warranties, express or implied, regarding the accuracy, completeness, or suitability of any content or products presented. Nothing on this website should be construed as legal, tax, investment, financial, medical, or other professional advice. In addition, no part of this site—including articles or product references—constitutes a solicitation, recommendation, endorsement, advertisement, or offer to buy or sell any securities, franchises, or other financial instruments, particularly in jurisdictions where such activity would be unlawful.
All content is of a general nature and may not address the specific circumstances of any individual or entity. It is not a substitute for professional advice or services. Any actions you take based on the information provided here are strictly at your own risk. You accept full responsibility for any decisions or outcomes arising from your use of this website and agree to release us from any liability in connection with your use of, or reliance upon, the content or products found herein.