
|
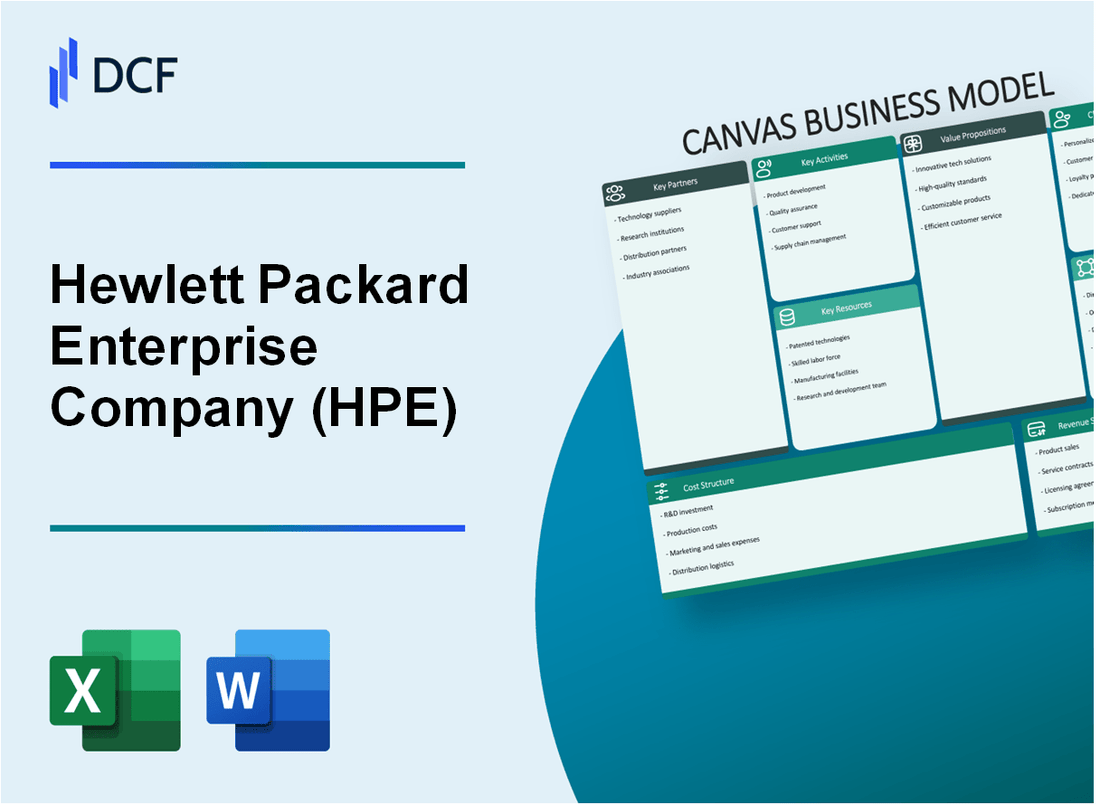
Hewlett Packard Enterprise Company (HPE): Business Model Canvas [Dec-2025 Updated] |
Fully Editable: Tailor To Your Needs In Excel Or Sheets
Professional Design: Trusted, Industry-Standard Templates
Investor-Approved Valuation Models
MAC/PC Compatible, Fully Unlocked
No Expertise Is Needed; Easy To Follow
Hewlett Packard Enterprise Company (HPE) Bundle
As someone who spent a decade mapping out tech giants for BlackRock, I can tell you Hewlett Packard Enterprise Company's real story isn't in the Q4 server sales of $4.5 billion; it's in the pivot. You're looking at a company that has defintely traded box-selling for outcome-delivering, primarily through the GreenLake platform, a shift clearly reflected in their late 2025 numbers showing a $3.2 billion Annual Recurring Revenue. This Business Model Canvas distills that complex transition-from hardware logistics to AI-native infrastructure-into the nine essential building blocks you need to understand their valuation today. It's a masterclass in modern IT service delivery, so let's break down the mechanics below.
Hewlett Packard Enterprise Company (HPE) - Canvas Business Model: Key Partnerships
You're looking at the ecosystem that powers Hewlett Packard Enterprise Company's strategy right now, especially as they push hard into AI infrastructure. These aren't just vendor relationships; they are foundational to how Hewlett Packard Enterprise Company delivers its value proposition in late 2025.
The strength of the channel is definitely a major factor in Hewlett Packard Enterprise Company's results. For instance, channel-led results were significant to the overall Q1 FY25 financial performance, showing positive year-over-year revenue growth for the indirect Hybrid Cloud and Server segments.
AI Infrastructure Alliances: NVIDIA and AMD
The collaboration with NVIDIA is central to Hewlett Packard Enterprise Company's AI factory vision, especially in Europe, addressing data sovereignty needs. This joint effort is driving substantial numbers in the high-performance computing space. Hewlett Packard Enterprise Company's AI systems revenue, for example, surged to $1.6 billion in Q3 2025. To put that in context, NVIDIA's data center revenue hit $51.2 billion in the same period. The physical manifestation of this is the AI Factory Lab in Grenoble, France, designed for customers to validate sovereign AI workloads.
On the open standards front, the partnership with AMD for the Helios AI rack-scale architecture is a direct counterpoint to proprietary interconnects. Hewlett Packard Enterprise Company is one of the first OEMs to adopt this, planning to offer the complete turnkey rack worldwide starting in 2026. This architecture is engineered for serious scale, targeting up to 2.9 exaFLOPS of FP4 performance per rack.
Here's a quick look at the quantitative aspects of these compute partnerships:
| Partner | Key Metric/Product | Reported Value/Target | Context/Availability |
| NVIDIA | HPE AI Systems Revenue (Q3 2025) | $1.6 billion | Reported for Q3 Fiscal Year 2025 |
| NVIDIA | AI Factory Lab Location | Grenoble, France | For sovereign AI validation |
| AMD | Helios Rack FP4 Performance Target | 2.9 exaFLOPS per rack | Using AMD Instinct MI455X GPUs |
| AMD | Helios Availability | Worldwide in 2026 | HPE is an early adopter |
| HPE | Trailing Twelve Months Revenue | $33.08 billion | Reflecting overall company scale |
Cloud and Ecosystem Recognition
The relationship with Microsoft is validated by industry recognition. Hewlett Packard Enterprise Company was named the Global Technology Partner of the Year 2025 by Microsoft, specifically for cloud and hybrid solutions. This alignment is crucial as Hewlett Packard Enterprise Company continues to build out its GreenLake hybrid cloud offering, which is seeing its recurring revenue grow.
Channel and Service Delivery Backbone
The global distribution and managed service delivery rely heavily on key channel players. TD SYNNEX, for instance, was honored as the HPE 2025 Global Distributor of the Year, a recognition that celebrates their financial results and innovative solutions. This distributor supports over 150,000 customers across more than 100 countries. Also recognized was Deloitte, which earned the title of HPE Global System Integrator Partner of the Year 2025. Deloitte's involvement often centers on complex deployments, such as building AI-driven test platforms and network infrastructure analytics.
Edge Networking Integration
The partnership with T-Mobile focuses on bringing enterprise-grade networking to the small business segment via a subscription model. This joint offering combines the T-Mobile Connected Workspace Program, which includes the Managed 5G Gateway service, with Hewlett Packard Enterprise Company's Networking Instant On Switch Series 1830 and Access Point AP21. This move helps Hewlett Packard Enterprise Company connect the network edge to the cloud for service provider customers.
To be fair, the success of these partnerships is reflected in Hewlett Packard Enterprise Company's year-end figures. The company ended fiscal 2025 with an annualized revenue run rate (ARR) of about $3.2 billion, with more than 80 percent of that coming from software and services aligned to AI and hybrid cloud workloads.
Finance: draft 13-week cash view by Friday.
Hewlett Packard Enterprise Company (HPE) - Canvas Business Model: Key Activities
You're looking at the core engine room of Hewlett Packard Enterprise Company (HPE) as of late 2025, focusing on what they actually do to drive that edge-to-cloud strategy. It's all about execution now, especially after the big Juniper Networks purchase.
Developing and integrating the GreenLake edge-to-cloud platform
The GreenLake platform is where HPE monetizes its consumption-as-a-service model, and the numbers show real traction there. You see this in the Annualized Revenue Run-Rate (ARR), which is the key metric for subscription growth. For the fourth quarter of fiscal year 2025, the GreenLake subscription business ARR hit $3.2 billion, marking a substantial 68.4 percent year-over-year increase. Just one quarter earlier, in Q3 FY2025, the ARR was reported at $3.1 billion, which was up 77 percent year-over-year in actual dollars. This platform is clearly scaling up; HPE added about 7,000 new customers in fiscal 2025, bringing the total customer count to roughly 46,000. The Hybrid Cloud segment, which houses GreenLake, saw revenue growth of 5 percent for the full fiscal year 2025.
Key GreenLake adoption metrics:
- GreenLake ARR (Q4 FY2025): $3.2 billion.
- New GreenLake customers added in FY2025: circa 7,000.
- Total GreenLake customers (End of FY2025): circa 46,000.
- Hybrid Cloud revenue growth (FY2025): 5 percent.
R&D in AI-native infrastructure, including HPE Cray supercomputing
Hewlett Packard Enterprise Company (HPE) is heavily focused on capturing the AI infrastructure build-out profitably, especially with sovereign and enterprise customers. The demand is translating directly into orders. For the entirety of fiscal year 2025, AI systems orders totaled a strong $6.8 billion. Looking specifically at the fourth quarter of fiscal 2025, HPE recognized $1.0 billion in AI-related revenue, which represented about 10 percent of the total Q4 revenue. The backlog, which shows future committed work, is also expanding rapidly; as of the end of the October quarter, the specific AI backlog stood at $4.7 billion, a near 96 percent year-over-year increase. This R&D effort includes advancing their supercomputing capabilities, such as the 'Herder' supercomputer built on the HPE Cray Supercomputing GX5000 platform, which integrates AMD Instinct MI430X GPUs.
Integrating Juniper Networks' AI-native networking portfolio
The integration of Juniper Networks, which closed in July 2025 for approximately $14 billion, is a massive activity reshaping HPE's structure. This move immediately boosted the networking segment, which is now central to the company's strategy. For Q4 FY2025, Networking revenue was $2.8 billion, a huge 150 percent year-over-year jump, which included four months of Juniper results. For the full fiscal year 2025, total Networking revenue reached $6.9 billion, showing a 51 percent increase year-over-year. HPE is banking on this to continue, projecting FY26 networking revenue growth of 65%-70% reported. They are also cross-pollinating AIOps platforms, simplifying IT operations with a dual platform combining Aruba Central and Juniper Mist.
Managing a global supply chain for hardware and components
Supply chain management is a critical activity supporting the overall revenue generation, which for the full fiscal year 2025 reached $34.3 billion, up 13.8 percent from the prior year. Operational discipline in Q4 FY2025 resulted in record gross profit and robust non-GAAP operating profit, partly due to disciplined spending and supply management. The company's gross margin in Q4 FY2025 was 33.5 percent GAAP. This operational focus helps translate revenue into cash flow; Q4 FY2025 Free Cash Flow was $1.92 billion.
Executing structural cost management initiatives (Catalyst program)
Hewlett Packard Enterprise Company (HPE) is actively executing the Catalyst program to drive structural cost savings and improve operating leverage. The company anticipates that by fiscal year 2028, Catalyst will deliver at least $350 million in gross savings. To be fair, they are already seeing results; HPE exceeded its Catalyst-related cost reduction targets, capturing more than 20 percent of the $350 million annual run rate target in fiscal 2025. This is in addition to the expected $600 million in cost savings from Juniper-related synergies by FY2028. These combined efforts aim for roughly $1 billion in structural cost savings by that date.
Here's a quick look at the financial scale supporting these key activities for the full fiscal year 2025:
| Key Financial Metric (FY2025) | Amount/Value | Context |
| Total Revenue | $34.3 billion | Up 13.8 percent Year-over-Year. |
| AI Systems Orders | $6.8 billion | Total orders for fiscal year 2025. |
| GreenLake ARR (End of Q4) | $3.2 billion | Up 68.4 percent Year-over-Year. |
| Networking Revenue (FY2025) | $6.9 billion | Up 51 percent Year-over-Year, including Juniper. |
| Catalyst Savings Captured (FY2025) | More than 20 percent of $350M target | Progress against the FY2028 goal. |
| Q4 FY2025 Free Cash Flow | $1.92 billion | Exceeded outlook. |
Hewlett Packard Enterprise Company (HPE) - Canvas Business Model: Key Resources
You're looking at the core assets that power Hewlett Packard Enterprise Company's entire go-to-market strategy, especially as they push the as-a-service model. These aren't just line items; they are the foundation for their recurring revenue ambitions.
HPE GreenLake cloud platform intellectual property (IP) and software represent a massive moat. The shift to consumption-based IT is underpinned by this platform's software layer. As of the third quarter of fiscal year 2025, the Annualized Revenue Run Rate (ARR) for GreenLake, which is heavily weighted toward software and services, saw its annualized revenue run-rate surge to $3.2 billion, up 63% from the prior-year period in actual dollars. This ARR growth shows the increasing value captured by the platform's software and service components. Honestly, this software IP is what lets them manage hybrid environments seamlessly.
The Global patent portfolio and proprietary AI/HPC technology are critical for maintaining differentiation, particularly in high-growth areas like AI and High-Performance Computing (HPC). As of late 2025 data, Hewlett Packard Enterprise Company holds a total of 22,376 patents globally, with 13,307 of those patents being active. These patents are organized into 15,023 unique patent families. Furthermore, innovation is ongoing, with Hewlett Packard Enterprise Company announcing the registration of 40 new patents developed at its Research and Development Center in Costa Rica in November 2025. This proprietary tech is what enables their leadership in areas like the cooling architecture for next-generation AI systems.
The reach of the sales and customer engagement model is substantial. While the exact size of the integrated sales force isn't explicitly itemized, the company's total global team powering performance was reported at 60,000+ individuals as of fiscal year 2025. This team supports a rapidly expanding customer base for the flagship offering. The global network of Hewlett Packard Enterprise Company unique GreenLake customers reached 44,000 as of the end of the third quarter of fiscal year 2025, up from 39,000 customers at the end of fiscal year 2024. That's serious adoption velocity you need to track.
Here's a quick look at the hard numbers underpinning these key physical and financial assets:
| Key Resource Metric | Value (as of late 2025/FY2025 reporting) | Context/Unit |
| Total Global Patents | 22,376 | Count |
| Active Global Patents | 13,307 | Count |
| HPE GreenLake Customers | 44,000 | Unique Customers (Q3 FY2025) |
| Financial Services Net Portfolio Assets | $13.2 billion | Balance Sheet Value (Q4 FY2025) |
| Financial Services Return on Equity (ROE) | 20.8% | Percentage (Q4 FY2025) |
| Total Global Employees | 60,000+ | Count (FY2025) |
The Data center and manufacturing infrastructure worldwide remains a necessary physical backbone, supporting everything from High Performance Compute and Mission Critical Systems to the physical hardware underpinning the GreenLake cloud deployments. This includes the infrastructure inherited and integrated from acquisitions like Cray and Juniper Networks. It's the tangible asset base that allows them to promise and deliver on-premises and edge cloud capabilities.
Finally, the Financial Services' net portfolio assets provide the necessary capital engine to close deals and accelerate customer adoption of hardware and services. For the fourth quarter of fiscal year 2025, these assets stood at $13.2 billion. This financing arm delivered a return on equity of 20.8% for the same period. This financial capacity is a direct enabler for the sales force to structure complex, long-term consumption agreements.
- HPE GreenLake ARR mix: 71% software and services (as of Q3 FY2025 context).
- HPE GreenLake ARR growth: 63% year-over-year (Q4 FY2025).
- Most popular patent received 884 citations from companies like IBM, Hitachi, and Microsoft.
Finance: review the impact of the $13.2 billion asset base on Q1 2026 financing capacity by next Tuesday.
Hewlett Packard Enterprise Company (HPE) - Canvas Business Model: Value Propositions
You're looking at how Hewlett Packard Enterprise Company is structuring its value delivery in late 2025, and honestly, the numbers show a clear pivot toward recurring revenue and specialized infrastructure.
Cloud experience everywhere: Delivering IT as-a-Service on-premises or at the edge (GreenLake) is central. The Annualized Revenue Run-rate (ARR) for GreenLake hit $3.1 billion in Q3 FY2025. This metric, which annualizes the revenue from all net HPE GreenLake cloud services, related financial services revenue, and software-as-a-Service offerings, grew an impressive 77% year-over-year in Q3 FY2025. HPE added approximately 7,000 new customers to GreenLake, ending the year with roughly 46,000 customers.
Consumption-based IT: The pay-per-use model is gaining serious traction, as evidenced by the ARR growth. To be fair, the market values this recurring stream highly. Management highlighted that over 80% of the ARR now comes from software and services. This shift is key to their financial profile.
AI-native infrastructure: The demand for full-stack solutions for generative AI is translating directly into orders. Hewlett Packard Enterprise Company signed $6.8 billion in new AI system orders for fiscal year 2025. In the server segment specifically, fiscal year 2025 revenue grew 10% year-over-year.
Hybrid cloud simplification: While I don't have a direct metric for simplification, the portfolio consolidation is clear. The overall company revenue for fiscal year 2025 reached $34.3 billion, a 14% increase year-over-year, which includes the addition of Juniper Networks.
Secure, high-performance networking via integrated Aruba and Juniper technologies: This segment is a major growth driver following the Juniper Networks acquisition, which closed in July 2025. Networking segment revenue for the full fiscal year 2025 achieved $6.9 billion, marking a 51% increase year-over-year, incorporating four months of Juniper results. In Q4 2025 alone, networking revenue surged 150% year-over-year to $2.8 billion. The operating profit for the Networking segment in Q3 FY2025 was $360 million, up 43% year-over-year.
Here's a quick look at some key financial figures from the fiscal year 2025 results:
| Financial Metric | Value (FY2025 or latest period) |
| Total Company Revenue (FY25) | $34.3 billion |
| GreenLake ARR (Q3 FY25) | $3.1 billion |
| Networking Revenue (FY25) | $6.9 billion |
| AI Systems Orders (FY25) | $6.8 billion |
| Q4 2025 Non-GAAP Gross Margin | 36% |
| Total Company ARR (Q4 FY25, incl. Juniper) | $3.2 billion |
The momentum is visible in the profitability, too; the non-GAAP gross margin reached a record 36% in Q4 2025.
You should watch the growth in the software and services portion of the business, as over 80% of the ARR is now tied to those higher-margin offerings.
Finance: draft 13-week cash view by Friday.
Hewlett Packard Enterprise Company (HPE) - Canvas Business Model: Customer Relationships
Hewlett Packard Enterprise Company manages customer relationships through a multi-faceted approach, heavily weighted toward its consumption-based GreenLake platform and a newly unified partner ecosystem.
Dedicated account management for large enterprise and sovereign accounts
For the largest and most strategic clients, dedicated engagement remains key. You see this reflected in the procurement cycles for advanced infrastructure.
- AI demand remains uneven as some of HPE's larger sovereign customers are placing orders with extended lead times, which may defer shipments to future periods.
Partner-led service delivery model (Partner Ready Vantage)
The partner channel is central to service delivery, formalized under the Partner Ready Vantage program, which launched its first phase on November 1, 2025. This single program framework consolidates previous structures, including HPE Partner Ready and HPE Partner Ready for Networking.
The program is structured around three dedicated Centers to support specialization:
- Compute
- Hybrid Cloud
- Networking
Hewlett Packard Enterprise Company is driving partner engagement with specific financial incentives:
| Incentive Type | Detail/Amount | Focus Area |
| New Business Opportunity Booster | 10 percent on focus products; six percent for standard products | Winning new accounts |
| Hybrid Cloud Rebate Increase | 50 percent increase in North America for Gold and Platinum partners | Hybrid Cloud products |
| GreenLake Flex Sales Incentive | Up to 20 percent | Consumption solutions |
Integration of the Juniper Networks Partner Advantage program into Partner Ready Vantage is planned for 2026 and 2027.
Self-service and automated management via the GreenLake Central portal
The consumption-based GreenLake platform is the primary engine for recurring customer relationships, offering self-service capabilities. The Annualized Revenue Run-Rate (ARR) for GreenLake reached $3.2 billion by the end of fiscal 2025.
Customer acquisition metrics for the GreenLake cloud as of late 2025:
| Metric | Value (FY2025 End) | Source Period |
| Total GreenLake Customers | Circa 46,000 | End of Fiscal 2025 (October Quarter) |
| New GreenLake Customers Added (FY2025) | Approximately 7,000 | Fiscal Year 2025 |
| New GreenLake Customers Added (Q3 FY2025) | 2,000 | Third Quarter Fiscal 2025 |
| GreenLake ARR Growth (Y/Y) | 62% to 68.4% | Fiscal 2025 |
Software, AIOps, and services represented over 80% of the total company AIR.
Professional and operational services for deployment and support
The Service Track within Partner Ready Vantage consolidates various service offerings into a single ecosystem for partners. Competency in specific software suites is incentivized.
- Partners achieving competency in the HPE CloudOps Software Suite (which includes HPE OpsRamp Software) can earn a sales incentive of 10 percent.
The Service Track unifies Managed, Professional, and Support Services, offering partners unified tools and financial benefits.
Hewlett Packard Enterprise Company (HPE) - Canvas Business Model: Channels
You're mapping out how Hewlett Packard Enterprise Company (HPE) gets its solutions to market as of late 2025. The channel strategy is clearly a major component of their go-to-market engine, especially with the integration of Juniper Networks.
Global Channel Partners: Resellers, distributors, and service providers (indirect sales)
The indirect sales motion is substantial, driving the majority of revenue in key areas. In the fourth quarter of fiscal year 2025, sales through partners accounted for 65 percent of HPE revenue. This partner-led approach saw significant acceleration, with HPE's partner business growing 37 percent year over year in that same quarter.
The reliance on partners varies by segment:
- Networking revenue through partners represented 88 percent of that segment's total.
- Private Cloud contribution via partners stood at 77 percent of the total.
- Partner orders for Server products made up 56 percent of the total server contribution in Q4 FY25.
The unified channel structure, post-acquisition, immediately showed impact, contributing more than 85 percent of HPE Networking revenue in the first quarter of fiscal year 2025.
Direct Sales Force: Handling large enterprise, government, and HPC deals
The direct sales force targets the largest deals, including significant High Performance Computing (HPC) and AI infrastructure sales. Segment revenue performance in Q4 FY25 illustrates the scale of the business units these teams manage, alongside partners:
| Segment | Q4 FY2025 Revenue (Actual Dollars) | Year-over-Year Change (Q4 FY25 vs Q4 FY24) |
| Networking | $2.8 billion | Up 150 percent |
| Server | $4.5 billion | Down 5 percent |
| Hybrid Cloud | $1.4 billion | Down 12 percent |
For the full fiscal year 2025, HPE signed about $6.8 billion in AI orders, with sovereign and enterprise customers making up over 60 percent of cumulative AI demand since early 2023.
HPE GreenLake Marketplace: Ecosystem for third-party software and services
The consumption-based model, anchored by HPE GreenLake, shows strong recurring revenue momentum. The Annualized Revenue Run-Rate (ARR) for HPE GreenLake reached $3.2 billion in Q4 FY25, marking a 62 percent increase year over year. More than 80 percent of this $3.2 billion ARR originates from software and services supporting AI, data, and cloud operations. The total customer count for GreenLake reached roughly 46,000 organizations by the end of fiscal year 2025, with about 7,000 new customers added during that year.
HPE Financial Services: Offering leasing and financing options
HPE Financial Services provides the necessary financial structuring to close infrastructure deals. In the fourth quarter of fiscal year 2025, this segment generated revenue of $889 million. The net portfolio assets were valued at $13.2 billion at the end of Q4 FY25. The business delivered a return on equity of 20.8 percent in that same quarter.
The Board of Directors declared a regular cash dividend of $0.1425 per share, payable on or about January 16, 2026, to stockholders of record as of December 19, 2025.
Hewlett Packard Enterprise Company (HPE) - Canvas Business Model: Customer Segments
You're looking at the customer base for Hewlett Packard Enterprise Company (HPE) as of late 2025, which is heavily segmented by the type of infrastructure consumption model they prefer-from traditional purchase to as-a-service. The overall business is clearly pivoting, with the Annualized Revenue Run-rate (ARR) hitting $3.2 billion in the fourth quarter of fiscal 2025, marking a 63% increase year-over-year.
Here is a look at the revenue contribution by the core infrastructure segments in the fourth quarter of fiscal 2025, which gives you a clear picture of where the dollars are coming from:
| Segment | Q4 FY2025 Revenue (Actual Dollars) | Year-over-Year Change |
| Networking | $2.8 billion | Up 150% |
| Server | $4.5 billion | Down 5% |
| Hybrid Cloud | $1.4 billion | Down 12% |
| Financial Services | $889 million | Flat |
The customer segments map directly to these revenue streams, showing a focus on large-scale, high-growth infrastructure deployment.
Large Global Enterprises: Seeking hybrid cloud and AI infrastructure solutions.
This group is the primary consumer of HPE's high-end compute, which is now heavily focused on Artificial Intelligence. The Server segment, which houses much of this, generated $4.5 billion in revenue in the fourth quarter of fiscal 2025. The total AI orders for the entire fiscal year 2025 reached $6.8 billion. You should note that the company saw strong demand from sovereign customers, which helped AI orders outpace revenue due to shipment timing. These enterprises are driving the Hybrid Cloud segment, which brought in $1.4 billion in Q4 FY2025.
Mid-size Enterprises: Utilizing simplified GreenLake Private Cloud Business Edition.
While the specific 'Private Cloud Business Edition' numbers aren't broken out, the overall consumption model success is clear through the GreenLake platform metrics. HPE added approximately 2,000 new customers to GreenLake in the fourth quarter, bringing the total customer count to approximately 46,000 customers across on-premises and cloud environments by the end of fiscal year 2025. This indicates a broad base of mid-market and enterprise customers adopting the as-a-service consumption model.
Government and Public Sector: High-Performance Computing (HPC) and Sovereign AI needs.
This segment is a key driver for the high-end Server business, particularly around AI infrastructure. The search results explicitly mention strong demand from sovereign customers contributing to the $6.8 billion in AI orders booked during fiscal year 2025. This points directly to government and public sector entities investing heavily in private, secure AI compute capabilities.
Service Providers and Telcos: Deploying networking and edge solutions.
This group is the engine behind the massive growth in the Networking segment, which was renamed from Intelligent Edge to better reflect the market. The Networking revenue in Q4 FY2025 hit $2.8 billion, a 150% increase year-over-year, largely due to the inclusion of Juniper Networks, which closed in July 2025. This segment is focused on deploying modern, secure, AI-native networking portfolios across campus and branch environments.
- The total company TTM revenue as of July 31, 2025, was $33.075 billion.
- HPE's total revenue for the full fiscal year 2025 reached $34.3 billion.
- The Financial Services segment, which supports all other segments, managed net portfolio assets of $13.2 billion in Q4 FY2025.
Finance: draft 13-week cash view by Friday.
Hewlett Packard Enterprise Company (HPE) - Canvas Business Model: Cost Structure
You're looking at the expenses Hewlett Packard Enterprise Company (HPE) incurred to deliver its value propositions in the fourth quarter of fiscal 2025. The cost structure is heavily influenced by the cost of goods sold for its hardware and the significant investments required to scale its as-a-Service offerings like HPE GreenLake.
Cost of Sales was reported at $6.5 billion in Q4 2025, primarily covering the direct costs associated with the hardware and components sold across its segments. This figure represents the outlay before accounting for amortization, which is separated for clarity in their reporting.
The company's commitment to future offerings is reflected in its Research and Development (R&D) spending. For the fourth quarter of fiscal 2025, R&D expenses totaled $881 million. This investment is channeled into integrating AI capabilities across its portfolio, advancing the HPE GreenLake cloud platform, and enhancing networking solutions, especially following the Juniper Networks acquisition.
Managing the go-to-market engine requires substantial resources. Sales, General, and Administrative (SG&A) expenses for the quarter were $1,642 million. This covers the costs of maintaining a large global sales force necessary to service enterprise clients and drive adoption of both traditional and consumption-based models.
A notable component of the reported costs relates to non-cash charges, particularly the Amortization of intangible assets. This amounted to $310 million in Q4 2025. A significant portion of this is directly attributable to the accounting treatment of assets acquired, most notably the Juniper Networks purchase, which adds a substantial, recurring non-cash charge to the structure.
The operational side of the GreenLake consumption model introduces specific costs related to service delivery and infrastructure management. While direct operational costs are embedded, the focus on achieving synergies from recent large transactions highlights cost management priorities. Management has targeted achieving $600 million in cost savings from Juniper-related synergies by fiscal year 2028, which will impact both cost of sales and operating expenses.
Here's a quick look at the key reported expenses for the three months ended October 31, 2025, in millions:
| Cost Category | Q4 Fiscal 2025 Amount (Millions USD) | Context/Driver |
| Cost of Sales (excl. amortization) | $6,438 | Hardware and component procurement |
| Selling, General and Administrative | $1,642 | Global sales force and corporate overhead |
| Research and Development | $881 | AI, Cloud, and Networking integration |
| Amortization of Intangible Assets | $310 | Primarily Juniper Networks acquisition |
| Impairment Charges | $260 | Asset valuation adjustments |
The shift to consumption-based revenue, evidenced by the HPE GreenLake Annualized Revenue Run-Rate (ARR) reaching $3.2 billion (up 62% year-over-year), changes the nature of costs over time. This model requires upfront investment in capacity and ongoing service delivery infrastructure, which is a key operational cost consideration.
The cost structure also includes specific charges related to strategic moves:
- Acquisition, disposition and other charges for Q4 2025 were $156 million.
- The non-GAAP full-year 2026 operating profit outlook excludes costs of approximately $2.9 billion related to amortization, stock-based compensation, and acquisition charges.
- The company expects headwinds of approximately $650 million in interest and other, net for the full year 2026.
To be fair, the GAAP results are impacted by these large non-cash items, which is why non-GAAP metrics are often used to assess the underlying operational cost efficiency. Finance: draft 13-week cash view by Friday.
Hewlett Packard Enterprise Company (HPE) - Canvas Business Model: Revenue Streams
You're looking at how Hewlett Packard Enterprise Company actually brings in the money, which is key for understanding its valuation right now. The revenue streams are clearly segmented, showing a mix of traditional sales and a growing focus on recurring models.
For the fourth quarter of fiscal 2025, Hewlett Packard Enterprise Company reported total revenue of $9.7 billion. This represented a 14% increase from the prior-year period. The revenue mix clearly shows the impact of recent strategic moves, especially the Juniper Networks acquisition.
Here's a breakdown of the key revenue components from Q4 2025:
| Revenue Stream Category | Q4 2025 Revenue Amount | Year-over-Year Change |
| Server Revenue | $4.5 billion | Down 5% |
| Networking Revenue | $2.8 billion | Up 150% |
| Financial Services Revenue | $889 million | Flat |
| Hybrid Cloud Revenue | $1.4 billion | Down 12% |
Hardware Sales still form a major part, anchored by the Server segment. Server revenue was $4.5 billion in Q4 2025, though this was down 5% from the year before, partly due to AI server shipment timing. Storage revenue is included within this hardware grouping, but the specific standalone number for storage isn't broken out separately in the primary segment reporting alongside the $4.5 billion for servers.
Consumption Services is where Hewlett Packard Enterprise Company is pushing its recurring revenue model, primarily through HPE GreenLake. The Annualized Revenue Run-Rate (ARR) is the metric management uses here. As of Q4 2025, the ARR hit $3.2 billion, which is a massive 63% increase year-over-year. This metric captures cloud services, software consumption, and related lease/interest income.
Networking Revenue saw the most dramatic shift. The integration of Juniper Networks propelled this segment to $2.8 billion in Q4 2025 revenue, marking a 150% increase year-over-year. This segment includes both hardware sales and associated services.
Financial Services revenue, which covers interest income and lease revenue, came in at $889 million for the quarter, showing flat performance compared to the prior year. The Return on Equity for this business was 20.8%.
Software and Services are positioned as high-margin offerings, with management emphasizing growth in areas like OpsRamp and Morpheus, which feed into the overall ARR growth. The Hybrid Cloud segment, which includes many of these as-a-Service offerings, generated $1.4 billion in revenue, down 12% year-over-year, as Hewlett Packard Enterprise Company strategically reduced exposure to lower-margin, non-IP-related businesses.
You can see the shift in focus by looking at the margins:
- Networking operating profit margin was 23% in Q4 2025.
- Server operating profit margin was 9.8%.
- Hybrid Cloud operating profit margin was 5%.
Finance: review the Q1 2026 revenue guidance range of $9.0B to $9.4B against the Q4 2025 actual of $9.7B by Monday.
Disclaimer
All information, articles, and product details provided on this website are for general informational and educational purposes only. We do not claim any ownership over, nor do we intend to infringe upon, any trademarks, copyrights, logos, brand names, or other intellectual property mentioned or depicted on this site. Such intellectual property remains the property of its respective owners, and any references here are made solely for identification or informational purposes, without implying any affiliation, endorsement, or partnership.
We make no representations or warranties, express or implied, regarding the accuracy, completeness, or suitability of any content or products presented. Nothing on this website should be construed as legal, tax, investment, financial, medical, or other professional advice. In addition, no part of this site—including articles or product references—constitutes a solicitation, recommendation, endorsement, advertisement, or offer to buy or sell any securities, franchises, or other financial instruments, particularly in jurisdictions where such activity would be unlawful.
All content is of a general nature and may not address the specific circumstances of any individual or entity. It is not a substitute for professional advice or services. Any actions you take based on the information provided here are strictly at your own risk. You accept full responsibility for any decisions or outcomes arising from your use of this website and agree to release us from any liability in connection with your use of, or reliance upon, the content or products found herein.