
|
Burlington Stores, Inc. (Burl) Avaliação DCF |
Totalmente Editável: Adapte-Se Às Suas Necessidades No Excel Ou Planilhas
Design Profissional: Modelos Confiáveis E Padrão Da Indústria
Pré-Construídos Para Uso Rápido E Eficiente
Compatível com MAC/PC, totalmente desbloqueado
Não É Necessária Experiência; Fácil De Seguir
Burlington Stores, Inc. (BURL) Bundle
Descubra o verdadeiro valor de Burlington Stores, Inc. (Burl) com nossa calculadora DCF avançada! Ajuste as principais suposições, explore vários cenários e examine como as mudanças afetam a avaliação da Burlington Stores, Inc. (BURL) - tudo dentro de um único modelo do Excel.
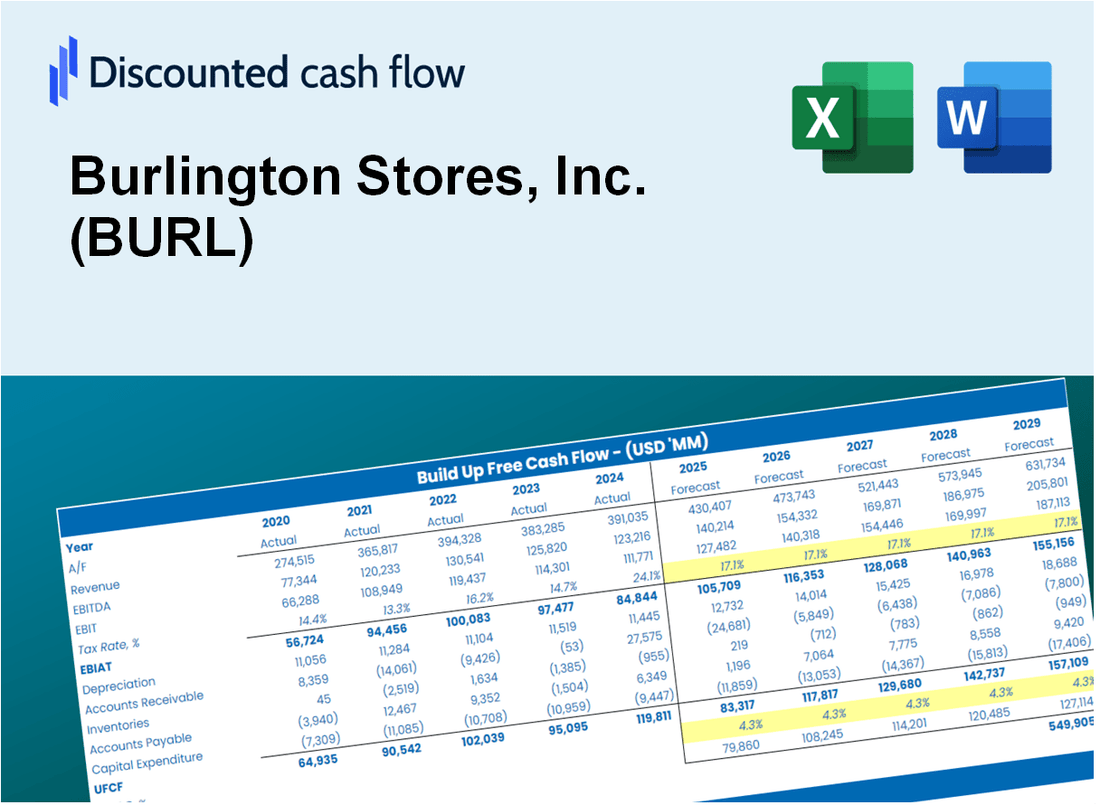
Discounted Cash Flow (DCF) - (USD MM)
| Year | AY1 2020 |
AY2 2021 |
AY3 2022 |
AY4 2023 |
AY5 2024 |
FY1 2025 |
FY2 2026 |
FY3 2027 |
FY4 2028 |
FY5 2029 |
|---|---|---|---|---|---|---|---|---|---|---|
| Revenue | 5,756.4 | 9,312.7 | 8,693.2 | 9,718.2 | 10,625.8 | 12,651.5 | 15,063.5 | 17,935.3 | 21,354.5 | 25,425.7 |
| Revenue Growth, % | 0 | 61.78 | -6.65 | 11.79 | 9.34 | 19.06 | 19.06 | 19.06 | 19.06 | 19.06 |
| EBITDA | -110.8 | 1,020.6 | 650.9 | 847.4 | 1,048.1 | 888.3 | 1,057.6 | 1,259.2 | 1,499.3 | 1,785.1 |
| EBITDA, % | -1.92 | 10.96 | 7.49 | 8.72 | 9.86 | 7.02 | 7.02 | 7.02 | 7.02 | 7.02 |
| Depreciation | 203.5 | 230.3 | 249.2 | 284.1 | 321.9 | 375.2 | 446.7 | 531.9 | 633.2 | 754.0 |
| Depreciation, % | 3.54 | 2.47 | 2.87 | 2.92 | 3.03 | 2.97 | 2.97 | 2.97 | 2.97 | 2.97 |
| EBIT | -314.3 | 790.3 | 401.7 | 563.3 | 726.2 | 513.1 | 610.9 | 727.4 | 866.1 | 1,031.2 |
| EBIT, % | -5.46 | 8.49 | 4.62 | 5.8 | 6.83 | 4.06 | 4.06 | 4.06 | 4.06 | 4.06 |
| Total Cash | 1,380.3 | 1,091.1 | 872.6 | 925.4 | 994.7 | 1,635.0 | 1,946.7 | 2,317.8 | 2,759.7 | 3,285.8 |
| Total Cash, percent | .0 | .0 | .0 | .0 | .0 | .0 | .0 | .0 | .0 | .0 |
| Account Receivables | 62.2 | 54.1 | 71.1 | 74.4 | 88.1 | 103.0 | 122.7 | 146.1 | 173.9 | 207.1 |
| Account Receivables, % | 1.08 | 0.58081 | 0.81778 | 0.76518 | 0.82892 | 0.81451 | 0.81451 | 0.81451 | 0.81451 | 0.81451 |
| Inventories | 740.8 | 1,021.0 | 1,182.0 | 1,087.8 | 1,250.8 | 1,528.2 | 1,819.5 | 2,166.4 | 2,579.4 | 3,071.1 |
| Inventories, % | 12.87 | 10.96 | 13.6 | 11.19 | 11.77 | 12.08 | 12.08 | 12.08 | 12.08 | 12.08 |
| Accounts Payable | 862.6 | 1,080.8 | 955.8 | 956.4 | 1,038.1 | 1,447.3 | 1,723.2 | 2,051.7 | 2,442.8 | 2,908.6 |
| Accounts Payable, % | 14.99 | 11.61 | 10.99 | 9.84 | 9.77 | 11.44 | 11.44 | 11.44 | 11.44 | 11.44 |
| Capital Expenditure | -273.3 | -353.0 | -451.1 | -517.3 | -892.0 | -694.4 | -826.8 | -984.5 | -1,172.2 | -1,395.6 |
| Capital Expenditure, % | -4.75 | -3.79 | -5.19 | -5.32 | -8.39 | -5.49 | -5.49 | -5.49 | -5.49 | -5.49 |
| Tax Rate, % | 25.37 | 25.37 | 25.37 | 25.37 | 25.37 | 25.37 | 25.37 | 25.37 | 25.37 | 25.37 |
| EBITAT | -155.5 | 592.5 | 300.6 | 410.8 | 542.0 | 355.9 | 423.8 | 504.6 | 600.8 | 715.3 |
| Depreciation | ||||||||||
| Changes in Account Receivables | ||||||||||
| Changes in Inventories | ||||||||||
| Changes in Accounts Payable | ||||||||||
| Capital Expenditure | ||||||||||
| UFCF | -165.6 | 415.8 | -204.3 | 269.0 | -123.0 | 153.4 | 8.6 | 10.2 | 12.1 | 14.5 |
| WACC, % | 9.81 | 10.03 | 10.03 | 10.01 | 10.02 | 9.98 | 9.98 | 9.98 | 9.98 | 9.98 |
| PV UFCF | ||||||||||
| SUM PV UFCF | 171.5 | |||||||||
| Long Term Growth Rate, % | 3.50 | |||||||||
| Free cash flow (T + 1) | 15 | |||||||||
| Terminal Value | 231 | |||||||||
| Present Terminal Value | 143 | |||||||||
| Enterprise Value | 315 | |||||||||
| Net Debt | 4,377 | |||||||||
| Equity Value | -4,062 | |||||||||
| Diluted Shares Outstanding, MM | 65 | |||||||||
| Equity Value Per Share | -62.88 |
What You Will Get
- Real BURL Financials: Access to historical and projected data for precise valuation.
- Customizable Inputs: Adjust WACC, tax rates, revenue growth, and capital expenditures as needed.
- Dynamic Calculations: Intrinsic value and NPV are automatically computed.
- Scenario Analysis: Evaluate various scenarios to assess Burlington's future performance.
- User-Friendly Design: Designed for professionals while remaining accessible to newcomers.
Key Features
- Comprehensive DCF Calculator: Features detailed unlevered and levered DCF valuation models tailored for Burlington Stores, Inc. (BURL).
- WACC Calculator: Pre-configured Weighted Average Cost of Capital sheet with adjustable parameters for precise calculations.
- Customizable Forecast Assumptions: Easily alter growth projections, capital expenditures, and discount rates.
- Integrated Financial Ratios: Evaluate profitability, leverage, and efficiency ratios specifically for Burlington Stores, Inc. (BURL).
- Visual Dashboard and Charts: Graphical representations summarize essential valuation metrics for straightforward analysis.
How It Works
- Step 1: Download the Excel file.
- Step 2: Review pre-entered Burlington Stores, Inc. (BURL) data (historical and projected).
- Step 3: Adjust key assumptions (yellow cells) based on your analysis.
- Step 4: View automatic recalculations for Burlington Stores, Inc. (BURL)’s intrinsic value.
- Step 5: Use the outputs for investment decisions or reporting.
Why Choose This Calculator for Burlington Stores, Inc. (BURL)?
- User-Friendly Interface: Perfectly crafted for both novices and seasoned professionals.
- Customizable Inputs: Adjust parameters easily to suit your financial analysis needs.
- Real-Time Valuation: Observe immediate updates to Burlington's valuation as you tweak the inputs.
- Preloaded Data: Comes equipped with Burlington's current financial metrics for swift assessments.
- Relied Upon by Experts: Favored by investors and analysts for making well-informed choices.
Who Should Use This Product?
- Finance Students: Explore retail valuation methods and practice with real market data for Burlington Stores, Inc. (BURL).
- Academics: Integrate established retail models into your teaching or research involving Burlington Stores, Inc. (BURL).
- Investors: Validate your investment strategies and assess valuation projections for Burlington Stores, Inc. (BURL).
- Analysts: Enhance your efficiency with a ready-to-use, adaptable DCF model tailored for Burlington Stores, Inc. (BURL).
- Small Business Owners: Discover the analytical approaches used for evaluating large retail firms like Burlington Stores, Inc. (BURL).
What the Template Contains
- Preloaded BURL Data: Historical and projected financial data, including revenue, EBIT, and capital expenditures.
- DCF and WACC Models: Professional-grade sheets for calculating intrinsic value and Weighted Average Cost of Capital.
- Editable Inputs: Yellow-highlighted cells for adjusting revenue growth, tax rates, and discount rates.
- Financial Statements: Comprehensive annual and quarterly financials for deeper analysis.
- Key Ratios: Profitability, leverage, and efficiency ratios to evaluate performance.
- Dashboard and Charts: Visual summaries of valuation outcomes and assumptions.
Disclaimer
All information, articles, and product details provided on this website are for general informational and educational purposes only. We do not claim any ownership over, nor do we intend to infringe upon, any trademarks, copyrights, logos, brand names, or other intellectual property mentioned or depicted on this site. Such intellectual property remains the property of its respective owners, and any references here are made solely for identification or informational purposes, without implying any affiliation, endorsement, or partnership.
We make no representations or warranties, express or implied, regarding the accuracy, completeness, or suitability of any content or products presented. Nothing on this website should be construed as legal, tax, investment, financial, medical, or other professional advice. In addition, no part of this site—including articles or product references—constitutes a solicitation, recommendation, endorsement, advertisement, or offer to buy or sell any securities, franchises, or other financial instruments, particularly in jurisdictions where such activity would be unlawful.
All content is of a general nature and may not address the specific circumstances of any individual or entity. It is not a substitute for professional advice or services. Any actions you take based on the information provided here are strictly at your own risk. You accept full responsibility for any decisions or outcomes arising from your use of this website and agree to release us from any liability in connection with your use of, or reliance upon, the content or products found herein.