
|
Avaliação Tesco PLC (TSCO.L) DCF |
Totalmente Editável: Adapte-Se Às Suas Necessidades No Excel Ou Planilhas
Design Profissional: Modelos Confiáveis E Padrão Da Indústria
Pré-Construídos Para Uso Rápido E Eficiente
Compatível com MAC/PC, totalmente desbloqueado
Não É Necessária Experiência; Fácil De Seguir
Tesco PLC (TSCO.L) Bundle
Economize tempo e melhore a precisão com a nossa calculadora DCF (TSCOL)! Utilizando dados reais da TESCO e suposições personalizáveis, essa ferramenta permite que você preveja, analise e avalie a Tesco PLC como um investidor experiente.
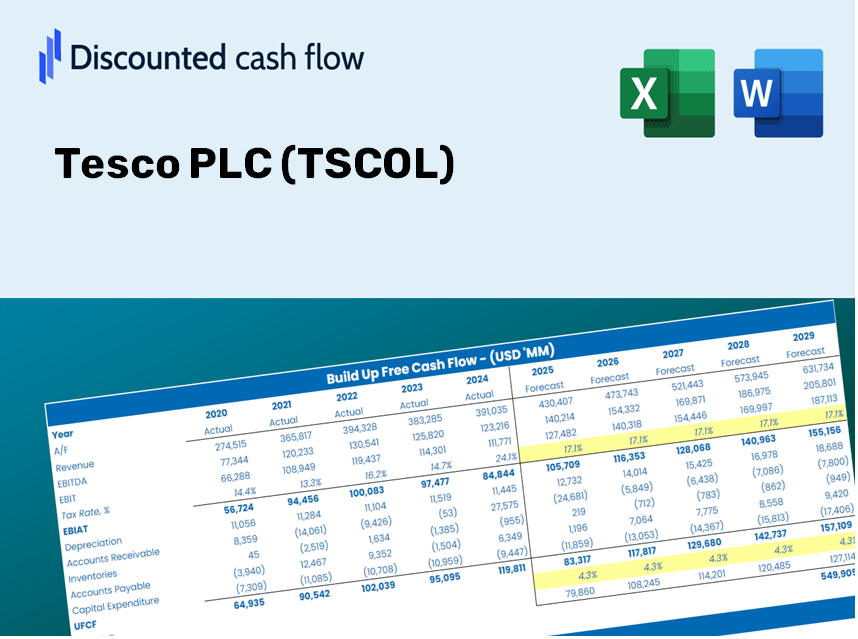
Discounted Cash Flow (DCF) - (USD MM)
| Year | AY1 2021 |
AY2 2022 |
AY3 2023 |
AY4 2024 |
AY5 2025 |
FY1 2026 |
FY2 2027 |
FY3 2028 |
FY4 2029 |
FY5 2030 |
|---|---|---|---|---|---|---|---|---|---|---|
| Revenue | 57,887.0 | 61,344.0 | 65,762.0 | 68,187.0 | 69,916.0 | 73,306.4 | 76,861.3 | 80,588.5 | 84,496.5 | 88,594.0 |
| Revenue Growth, % | 0 | 5.97 | 7.2 | 3.69 | 2.54 | 4.85 | 4.85 | 4.85 | 4.85 | 4.85 |
| EBITDA | 3,048.0 | 4,387.0 | 3,189.0 | 4,830.0 | 4,233.0 | 4,457.6 | 4,673.8 | 4,900.4 | 5,138.1 | 5,387.2 |
| EBITDA, % | 5.27 | 7.15 | 4.85 | 7.08 | 6.05 | 6.08 | 6.08 | 6.08 | 6.08 | 6.08 |
| Depreciation | 1,743.0 | 1,717.0 | 1,665.0 | 1,723.0 | 1,225.0 | 1,850.4 | 1,940.1 | 2,034.2 | 2,132.8 | 2,236.3 |
| Depreciation, % | 3.01 | 2.8 | 2.53 | 2.53 | 1.75 | 2.52 | 2.52 | 2.52 | 2.52 | 2.52 |
| EBIT | 1,305.0 | 2,670.0 | 1,524.0 | 3,107.0 | 3,008.0 | 2,607.3 | 2,733.7 | 2,866.2 | 3,005.2 | 3,151.0 |
| EBIT, % | 2.25 | 4.35 | 2.32 | 4.56 | 4.3 | 3.56 | 3.56 | 3.56 | 3.56 | 3.56 |
| Total Cash | 3,699.0 | 4,647.0 | 4,446.0 | 4,674.0 | 4,629.0 | 5,014.4 | 5,257.6 | 5,512.5 | 5,779.8 | 6,060.1 |
| Total Cash, percent | .0 | .0 | .0 | .0 | .0 | .0 | .0 | .0 | .0 | .0 |
| Account Receivables | 4,397.0 | 4,705.0 | 5,246.0 | 1,349.0 | 1,210.0 | 3,951.5 | 4,143.1 | 4,344.0 | 4,554.7 | 4,775.6 |
| Account Receivables, % | 7.6 | 7.67 | 7.98 | 1.98 | 1.73 | 5.39 | 5.39 | 5.39 | 5.39 | 5.39 |
| Inventories | 2,069.0 | 2,339.0 | 2,510.0 | 2,635.0 | 2,768.0 | 2,789.7 | 2,924.9 | 3,066.8 | 3,215.5 | 3,371.4 |
| Inventories, % | 3.57 | 3.81 | 3.82 | 3.86 | 3.96 | 3.81 | 3.81 | 3.81 | 3.81 | 3.81 |
| Accounts Payable | 8,399.0 | 9,181.0 | 9,762.0 | 10,264.0 | 10,364.0 | 10,878.1 | 11,405.7 | 11,958.8 | 12,538.7 | 13,146.7 |
| Accounts Payable, % | 14.51 | 14.97 | 14.84 | 15.05 | 14.82 | 14.84 | 14.84 | 14.84 | 14.84 | 14.84 |
| Capital Expenditure | -1,377.0 | -1,178.0 | -1,250.0 | -1,386.0 | -1,247.0 | -1,468.5 | -1,539.7 | -1,614.4 | -1,692.7 | -1,774.7 |
| Capital Expenditure, % | -2.38 | -1.92 | -1.9 | -2.03 | -1.78 | -2 | -2 | -2 | -2 | -2 |
| Tax Rate, % | 26.59 | 26.59 | 26.59 | 26.59 | 26.59 | 26.59 | 26.59 | 26.59 | 26.59 | 26.59 |
| EBITAT | 1,476.1 | 1,959.5 | 1,132.2 | 1,612.5 | 2,208.1 | 1,945.0 | 2,039.3 | 2,138.2 | 2,241.9 | 2,350.6 |
| Depreciation | ||||||||||
| Changes in Account Receivables | ||||||||||
| Changes in Inventories | ||||||||||
| Changes in Accounts Payable | ||||||||||
| Capital Expenditure | ||||||||||
| UFCF | 3,775.1 | 2,702.5 | 1,416.2 | 6,223.5 | 2,292.1 | 77.8 | 2,640.3 | 2,768.3 | 2,902.6 | 3,043.4 |
| WACC, % | 6.2 | 5.73 | 5.75 | 5.35 | 5.73 | 5.75 | 5.75 | 5.75 | 5.75 | 5.75 |
| PV UFCF | ||||||||||
| SUM PV UFCF | 9,396.9 | |||||||||
| Long Term Growth Rate, % | 2.00 | |||||||||
| Free cash flow (T + 1) | 3,104 | |||||||||
| Terminal Value | 82,726 | |||||||||
| Present Terminal Value | 62,544 | |||||||||
| Enterprise Value | 71,941 | |||||||||
| Net Debt | 12,411 | |||||||||
| Equity Value | 59,530 | |||||||||
| Diluted Shares Outstanding, MM | 6,918 | |||||||||
| Equity Value Per Share | 860.51 |
What You Will Receive
- Genuine TSCOL Financial Data: Pre-populated with Tesco's historical and projected figures for accurate analysis.
- Fully Customizable Template: Easily adjust essential inputs such as revenue growth, WACC, and EBITDA percentage.
- Instant Calculations: Watch Tesco’s intrinsic value refresh in real-time as you make updates.
- Expert Valuation Tool: Tailored for investors, analysts, and consultants in need of reliable DCF outcomes.
- User-Centric Design: Intuitive layout and straightforward instructions suitable for users of all experience levels.
Key Features
- 🔍 Real-Life TSCOL Financials: Pre-filled historical and projected data for Tesco PLC.
- ✏️ Fully Customizable Inputs: Modify all essential parameters (yellow cells) such as WACC, growth %, and tax rates.
- 📊 Professional DCF Valuation: Integrated formulas to assess Tesco’s intrinsic value using the Discounted Cash Flow method.
- ⚡ Instant Results: Quickly visualize Tesco’s valuation after making adjustments.
- Scenario Analysis: Evaluate and compare different outcomes based on various financial assumptions side-by-side.
How It Functions
- Download: Obtain the pre-loaded Excel file containing Tesco PLC's (TSCOL) financial data.
- Customize: Modify key forecasts such as revenue growth, EBITDA percentage, and WACC.
- Automatic Updates: The intrinsic value and NPV calculations refresh in real-time.
- Scenario Testing: Develop various projections and effortlessly compare the results.
- Make Informed Decisions: Utilize the valuation findings to shape your investment approach.
Why Choose the Tesco PLC (TSCOL) Financial Calculator?
- Time Efficient: Skip the hassle of building a DCF model from scratch – it’s immediately available for your use.
- Enhanced Precision: Dependable financial information and formulas minimize valuation discrepancies.
- Completely Customizable: Adjust the model to align with your unique assumptions and forecasts.
- Simple to Understand: Intuitive charts and outputs facilitate easy result analysis.
- Endorsed by Professionals: Created for experts who prioritize both accuracy and user-friendliness.
Who Should Benefit from This Product?
- Investors: Evaluate Tesco PLC’s (TSCOL) valuation before making stock transactions.
- CFOs and Financial Analysts: Enhance valuation processes and assess financial projections.
- Startup Founders: Discover how large public companies like Tesco PLC are valued.
- Consultants: Create comprehensive valuation reports for your clients.
- Students and Educators: Utilize real-world data to practice and teach valuation methodologies.
Contents of the Template
- Pre-Filled Data: Features Tesco PLC’s historical financials and projections.
- Discounted Cash Flow Model: An editable DCF valuation model with automated calculations.
- Weighted Average Cost of Capital (WACC): A dedicated worksheet for WACC calculations based on user-defined inputs.
- Key Financial Ratios: Assess Tesco PLC’s profitability, operational efficiency, and financial leverage.
- Customizable Inputs: Easily modify revenue growth rates, profit margins, and tax percentages.
- Clear Dashboard: Visual representations and summaries of key valuation outcomes.
Disclaimer
All information, articles, and product details provided on this website are for general informational and educational purposes only. We do not claim any ownership over, nor do we intend to infringe upon, any trademarks, copyrights, logos, brand names, or other intellectual property mentioned or depicted on this site. Such intellectual property remains the property of its respective owners, and any references here are made solely for identification or informational purposes, without implying any affiliation, endorsement, or partnership.
We make no representations or warranties, express or implied, regarding the accuracy, completeness, or suitability of any content or products presented. Nothing on this website should be construed as legal, tax, investment, financial, medical, or other professional advice. In addition, no part of this site—including articles or product references—constitutes a solicitation, recommendation, endorsement, advertisement, or offer to buy or sell any securities, franchises, or other financial instruments, particularly in jurisdictions where such activity would be unlawful.
All content is of a general nature and may not address the specific circumstances of any individual or entity. It is not a substitute for professional advice or services. Any actions you take based on the information provided here are strictly at your own risk. You accept full responsibility for any decisions or outcomes arising from your use of this website and agree to release us from any liability in connection with your use of, or reliance upon, the content or products found herein.