
|
Eni S.P.A. (E): 5 forças Análise [Jan-2025 Atualizada] |
Totalmente Editável: Adapte-Se Às Suas Necessidades No Excel Ou Planilhas
Design Profissional: Modelos Confiáveis E Padrão Da Indústria
Pré-Construídos Para Uso Rápido E Eficiente
Compatível com MAC/PC, totalmente desbloqueado
Não É Necessária Experiência; Fácil De Seguir
Eni S.p.A. (E) Bundle
No cenário dinâmico da energia global, o Eni S.P.A. navega em uma complexa rede de forças de mercado que moldam seu posicionamento estratégico e vantagem competitiva. Como uma grande empresa internacional de energia, a empresa enfrenta intrincados desafios nas relações de fornecedores, dinâmica do cliente, concorrência de mercado, interrupções tecnológicas e possíveis novos participantes de mercado. Entender isso cinco forças críticas revela que as estratégias diferenciadas que a Eni emprega para manter sua resiliência em um ecossistema energético cada vez mais volátil e transformador, onde a inovação, a sustentabilidade e as parcerias estratégicas são essenciais para o sucesso a longo prazo.
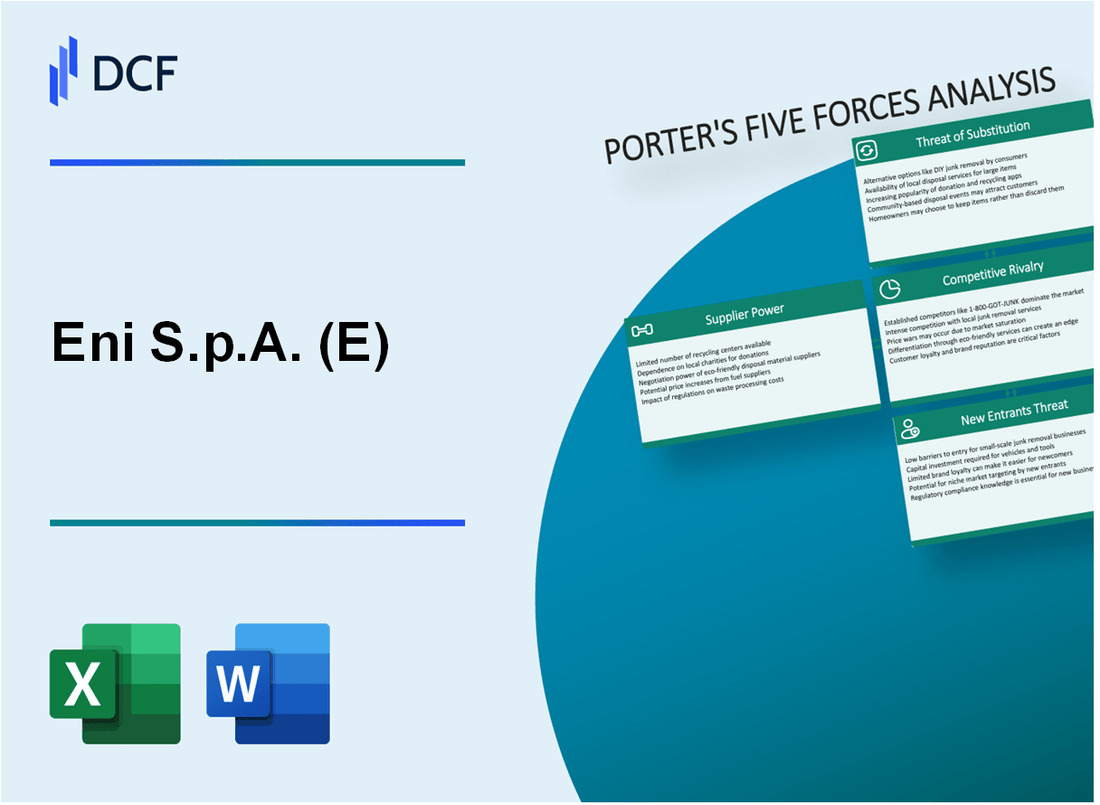
Eni S.P.A. (E) - As cinco forças de Porter: poder de barganha dos fornecedores
Número limitado de fabricantes globais de equipamentos de petróleo e gás
A partir de 2024, o mercado global de fabricação de equipamentos de petróleo e gás é dominado por alguns participantes importantes:
| Fabricante | Quota de mercado (%) | Receita anual (USD) |
|---|---|---|
| Schlumberger | 22.5% | US $ 35,4 bilhões |
| Halliburton | 18.3% | US $ 27,8 bilhões |
| Baker Hughes | 16.7% | US $ 24,5 bilhões |
| Technipfmc | 12.9% | US $ 19,6 bilhões |
Requisitos de alto conhecimento técnico
A infraestrutura de energia especializada exige recursos técnicos significativos:
- Investimento médio de P&D em equipamentos de petróleo e gás: 4,2% da receita anual
- Qualificações mínimas de engenharia: mestrado em engenharia de petróleo
- Requisitos de certificação especializados: ISO 9001: 2015, API Q1
Contratos de longo prazo com fornecedores de equipamentos
| Tipo de contrato | Duração média | Valor típico (USD) |
|---|---|---|
| Equipamento de exploração | 5-7 anos | US $ 150-250 milhões |
| Tecnologia de perfuração | 6-8 anos | US $ 180-300 milhões |
| Infraestrutura de produção | 7-10 anos | US $ 250-450 milhões |
Parcerias estratégicas com provedores de tecnologia
Métricas de parceria estratégica -chave para Eni S.P.A.:
- Número de parcerias de tecnologia ativa: 12
- Investimento anual de colaboração de tecnologia: € 345 milhões
- Colaborações de patentes: 7 acordos conjuntos de desenvolvimento de tecnologia
Eni S.P.A. (E) - As cinco forças de Porter: poder de barganha dos clientes
Diversificadas Base de Clientes
Eni S.P.A. serve uma base de clientes em vários setores:
| Segmento de clientes | Porcentagem da receita total |
|---|---|
| Clientes industriais | 42% |
| Entidades comerciais | 33% |
| Contratos governamentais | 25% |
Sensibilidade ao preço nos mercados globais de energia
Dinâmica de preços de energia para os clientes da ENI:
- Volatilidade média do preço do petróleo bruto: 15,7% em 2023
- Faixa de flutuação dos preços do gás natural: US $ 3,50 - US $ 8,75 por mmbtu
- Preço do contrato de energia renovável: € 45- € 65 por mwh
Negociação do contrato em larga escala
| Tipo de contrato | Valor médio do contrato | Alavancagem de negociação |
|---|---|---|
| Fornecimento de energia de longo prazo | € 350 milhões | Alto |
| Parceria industrial | € 180 milhões | Médio-alto |
Diversificação de produtos energéticos
O portfólio de produtos da ENI, reduzindo os custos de troca de clientes:
- Petróleo bruto: 35% da oferta de produto
- Gás natural: 28% da oferta de produto
- Energia renovável: 22% da oferta de produto
- Produtos refinados: 15% da oferta de produto
Eni S.P.A. (E) - As cinco forças de Porter: rivalidade competitiva
Forte concorrência das principais empresas internacionais de petróleo e gás
Eni S.P.A. enfrenta intensa concorrência das empresas globais de energia:
| Concorrente | 2023 Receita (bilhão de dólares) | Participação de mercado global (%) |
|---|---|---|
| Concha | 397.8 | 5.6 |
| ExxonMobil | 413.7 | 5.2 |
| Bp | 245.6 | 3.8 |
| Energias totais | 256.4 | 4.1 |
| Eni S.P.A. | 117.3 | 1.9 |
Dinâmica de mercado global intensa
Principais características da paisagem competitiva:
- Produção global a montante: 1,7 milhão de barris por dia
- Ativos de exploração em 41 países
- Índice de Concentração de Mercado Competitivo: 0,65
Investimentos de inovação tecnológica
Métricas de investimento tecnológico:
| Categoria de inovação | 2023 investimento (milhões de dólares) |
|---|---|
| Tecnologias de baixo carbono | 1,250 |
| Transformação digital | 450 |
| Energia renovável P&D | 680 |
Investimentos do setor de energia renovável e de baixo carbono
Detalhes do portfólio de energia renovável:
- Capacidade instalada renovável total: 2,1 GW
- Projetos de hidrogênio verde: 5 iniciativas ativas
- Capacidade de captura de carbono: 1,3 milhão de toneladas por ano
Eni S.P.A. (E) - As cinco forças de Porter: ameaça de substitutos
Alternativas de energia renovável em crescimento desafiando os combustíveis fósseis tradicionais
Em 2023, a capacidade de energia renovável global atingiu 3.496 GW, com responsabilidade de 1.495 GW. O portfólio de energia renovável da ENI expandiu -se para 2 GW de capacidade instalada, representando um aumento de 15% em relação a 2022.
| Fonte de energia | Capacidade global (GW) | Investimento de Eni |
|---|---|---|
| Solar | 1,185 | 0,8 GW |
| Vento | 310 | 1.2 GW |
Aumento do veículo elétrico e tecnologias de energia limpa
As vendas globais de veículos elétricos atingiram 14 milhões de unidades em 2023, representando 18% do total de participação no mercado automotivo.
- Vendas de veículos elétricos de bateria: 10,5 milhões de unidades
- Vendas de veículos híbridos plug-in: 3,5 milhões de unidades
- Investimento da ENI em infraestrutura de cobrança de EV: € 250 milhões
Políticas governamentais que promovem transições de energia sustentável
Os investimentos globais de política energética renovável totalizaram US $ 532 bilhões em 2023, com grandes compromissos da UE, EUA e China.
| Região | Investimento de política renovável | Alvo de descarbonização |
|---|---|---|
| União Europeia | € 187 bilhões | Redução de 55% de emissões até 2030 |
| Estados Unidos | US $ 141 bilhões | Redução de 50% de emissões até 2030 |
Investimentos estratégicos da Eni em fontes de energia alternativas
A ENI comprometeu 7,5 bilhões de euros a investimentos de baixo carbono em 2023, visando 85% do gasto total de capital em relação a projetos renováveis e de baixo carbono.
- Investimento de projetos de hidrogênio: € 1,2 bilhão
- Desenvolvimento de biocombustíveis: € 750 milhões
- Tecnologias de captura de carbono: € 500 milhões
Eni S.P.A. (E) - As cinco forças de Porter: ameaça de novos participantes
Altos requisitos de capital para exploração e produção de energia
As despesas de capital de exploração e produção da ENI em 2022: 6,2 bilhões de euros. Investimento inicial médio para uma nova plataforma de petróleo offshore: US $ 500 milhões a US $ 1 bilhão. Os custos de exploração e inicialização de produção upstream variam entre US $ 50 milhões e US $ 300 milhões por projeto.
| Categoria de requisito de capital | Faixa de custo estimada |
|---|---|
| Plataforma de petróleo offshore | US $ 500 milhões - US $ 1 bilhão |
| Projeto de exploração Investimento inicial | US $ 50 milhões - US $ 300 milhões |
| ENI Anual a montante Capex | 6,2 bilhões de euros |
Ambientes regulatórios complexos
Custos de conformidade regulatória para novos participantes do mercado de energia: estimado 15-25% do investimento total do projeto. Número de jurisdições internacionais A ENI opera em: 69 países.
- Porcentagem de conformidade regulatória do investimento do projeto: 15-25%
- Países da presença operacional da ENI: 69
- Tempo médio para obter licenças de perfuração: 18-36 meses
Barreiras tecnológicas e de infraestrutura
Custo avançado da tecnologia de imagem sísmica: US $ 10-50 milhões por projeto de exploração. Investimento em tecnologia de exploração de águas profundas: aproximadamente US $ 200 a 500 milhões.
| Investimento em tecnologia | Intervalo de custos |
|---|---|
| Tecnologia de imagem sísmica | US $ 10-50 milhões por projeto |
| Tecnologia de exploração de águas profundas | US $ 200-500 milhões |
Rede global estabelecida
Área de Exploração Global da ENI: 285.000 quilômetros quadrados. Reservas comprovadas e prováveis: 7,4 bilhões de barris de petróleo equivalentes. Produção anual: 1,7 milhão de barris de petróleo equivalente por dia.
- Área de Exploração Global: 285.000 quilômetros quadrados
- Reservas comprovadas e prováveis: 7,4 bilhões de Boe
- Produção diária: 1,7 milhão de boe
Eni S.p.A. (E) - Porter's Five Forces: Competitive rivalry
Rivalry is intense among supermajors like Shell, TotalEnergies, and BP, and state-owned enterprises, all vying for market share and favorable asset positions in the evolving energy landscape. This competition plays out across both traditional Exploration & Production (E&P) and the growing renewables sector, as competitors execute dual strategies.
The capital allocation battleground is fierce, driven by the need to fund both hydrocarbon development and the energy transition. Eni S.p.A. is navigating this by tightening its spending plans, which reflects the competitive pressure on capital efficiency. For the full-year 2025, Eni S.p.A. revised its gross capital expenditure guidance to be below €8.5 billion, a reduction from the initial guidance of below €9 billion. Furthermore, the proforma net capital expenditure expectation was lowered to below €5 billion, down from the initial range of €6.5-€7 billion.
Eni S.p.A.'s 2025 full-year production guidance of 1.71-1.72 Mboed (million barrels of oil equivalent per day) serves as a key metric in this rivalry, demonstrating the drive for volume growth even amidst portfolio high-grading. This was an upward revision from the initial 1.7 Mboed forecast. The third quarter of 2025 saw actual production reach 1.76 million barrels/day.
The focus on margin capture in specific business areas highlights the strategic competition for profitability. Eni S.p.A.'s Global Gas & LNG Portfolio (GGP) adjusted EBIT expectation for the full year 2025 was raised to over €1 billion, significantly better than the initial guidance of about €0.8 billion. This focus on maximizing margins in the gas supply portfolio is a direct competitive maneuver.
The structural nature of the industry creates high exit barriers, meaning competitors are locked into their positions due to massive sunk costs tied up in E&P infrastructure and refining assets. These long-term investments make rapid, full-scale exits difficult, intensifying the competition for incremental gains within existing asset bases.
Here's a look at how Eni S.p.A.'s revised 2025 outlook compares to earlier expectations, showing the impact of competitive and market dynamics on capital deployment:
| Metric | Initial 2025 Guidance | Revised 2025 Guidance (as of late 2025) |
| E&P Production Guidance (Mboed) | 1.7 | 1.71-1.72 |
| GGP Adjusted EBIT (€ billion) | About 0.8 | Over 1 |
| Gross Capex (€ billion) | Below 9 | Below 8.5 |
| Net Capex (€ billion) | 6.5-7 | Below 5 |
The commitment to shareholder returns is also a competitive tool, with Eni S.p.A. raising its FY 2025 share buyback commitment to €1.8 billion, an increase of €0.3 billion over the initial plan, reflecting confidence in the improved cash flow outlook despite the competitive environment.
The dual strategy execution is further evidenced by the capital deployment across segments:
- E&P proforma adjusted EBIT for Q3 2025 was €2.64 billion.
- Plenitude's installed renewable capacity target for year-end 2025 is 5.5 GW.
- Plenitude's proforma adjusted EBITDA is expected to be above €1.1 billion for the full year 2025.
Eni S.p.A. (E) - Porter's Five Forces: Threat of substitutes
You're looking at the substitution threat for Eni S.p.A. (E) and honestly, it's high and picking up speed, largely because of government mandates and cleaner tech getting cheaper.
The pressure comes from multiple angles, directly attacking both the power generation and the refined products segments of Eni S.p.A. (E)'s business. For instance, the global stock of electric cars displaced over 1 million barrels per day (b/d) of oil consumption in 2024. Projections for 2025 suggest global EV sales will hit 10 million units, potentially cutting oil demand by an additional 350,000 b/d.
Here's a quick look at the scale of these direct substitutes:
| Substitute Area | Metric | Value/Target | Source/Context |
|---|---|---|---|
| Plenitude Renewables | Installed Capacity (as of Sept 2025) | 4.8 GW | Wind and solar power generation |
| Enilive Biofuels | Target Biorefining Capacity (Near Term) | 1.65 MTPA | Total capacity, including HVO/SAF |
| Enilive SAF Production | Gela Plant Capacity | 400,000 metric tons per year | Represents almost a third of expected European SAF demand in 2025 |
| EV Displacement | Projected Oil Demand Reduction (2025) | 350,000 barrels per day | Based on projected global EV sales of 10 million units |
| Fusion Energy (CFS) | Eni S.p.A. (E) PPA Value | $1 billion+ | For power from the first ARC plant |
Plenitude, Eni S.p.A. (E)'s renewable arm, is directly replacing fossil-fuel power generation. As of September 2025, Plenitude had 4.8 GW of renewable energy capacity installed. The company is pushing hard, aiming for 10 GW by 2028 and 15 GW by 2030.
For the refined products side, Enilive is tackling diesel and jet fuel substitution. The current biorefining capacity is targeted at 1.65 MTPA. Specifically, the new Sustainable Aviation Fuel (SAF) plant at Gela has a capacity of 400,000 metric tons per year. This is significant because Regulation (EU) 2023/2405 mandates a minimum of 2% SAF in jet fuel supplied at EU airports starting 1 January 2025. Enilive is also targeting SAF production optionality of 1 MTPA by 2026.
The shift in personal transport is forcing a change in the refining and marketing segment. You see this in the accelerating EV adoption rates:
- Global EV sales projected to reach 10 million units in 2025.
- EVs accounted for roughly 25% of new car sales in 2025.
- The global EV fleet reached nearly 58 million units by the end of 2024.
- In Norway, 88% of new car sales were fully electric in 2024.
On the long-term, disruptive front, fusion energy represents a potential ultimate substitute for all thermal power generation. Eni S.p.A. (E) cemented its commitment by signing a Power Purchase Agreement (PPA) worth more than $1 billion with Commonwealth Fusion Systems (CFS) in September 2025. This secures Eni S.p.A. (E) the acquisition of decarbonized power from CFS's first 400 MW ARC fusion power plant, which is expected to connect to the grid in the early 2030s. Eni S.p.A. (E) is a strategic investor, participating in a funding round that brought CFS's total funding close to $3 billion.
Eni S.p.A. (E) - Porter's Five Forces: Threat of new entrants
Threat is low in traditional E&P due to massive capital and regulatory barriers.
Eni S.p.A.'s net capital expenditure for 2025 is expected to be below €6 billion, following a Q3 revision from initial guidance, implying the scale of required investment for entry in E&P.
Initial investment for a new offshore platform can range from $500 million to $1 billion.
Threat is moderate in the renewables and retail segments (Plenitude).
- Plenitude has an enterprise value of over €10 billion.
- Plenitude's organic capital expenditure averages around €1.4 billion per year over the 2024-2027 Plan.
- As of March 2025, Plenitude has over 4 GW of installed renewable capacity and over 10 million European clients.
- Energy Infrastructure Partners (EIP) invested up to €700 million for a stake corresponding to 10% of Plenitude's share capital.
Eni S.p.A.'s launch of a new Carbon Capture and Storage (CCS) satellite company in 2025 builds a new entry barrier in industrial decarbonization.
Established global logistics, trading networks, and existing long-term LNG contracts create a significant scale advantage.
| Metric | Value | Context/Term |
| New LNG Contract Volume | 2 million tonnes per annum (MTPA) | From Venture Global CP2 facility |
| Contract Term | 20 years | For the Venture Global LNG deal |
| Target LNG Portfolio Volume | Approximately 20 MTPA | Contracted volumes target by 2030 |
| Historical US LNG Cargoes to Italy | Nearly 40 cargoes | From Calcasieu Pass and Plaquemines facilities |
Disclaimer
All information, articles, and product details provided on this website are for general informational and educational purposes only. We do not claim any ownership over, nor do we intend to infringe upon, any trademarks, copyrights, logos, brand names, or other intellectual property mentioned or depicted on this site. Such intellectual property remains the property of its respective owners, and any references here are made solely for identification or informational purposes, without implying any affiliation, endorsement, or partnership.
We make no representations or warranties, express or implied, regarding the accuracy, completeness, or suitability of any content or products presented. Nothing on this website should be construed as legal, tax, investment, financial, medical, or other professional advice. In addition, no part of this site—including articles or product references—constitutes a solicitation, recommendation, endorsement, advertisement, or offer to buy or sell any securities, franchises, or other financial instruments, particularly in jurisdictions where such activity would be unlawful.
All content is of a general nature and may not address the specific circumstances of any individual or entity. It is not a substitute for professional advice or services. Any actions you take based on the information provided here are strictly at your own risk. You accept full responsibility for any decisions or outcomes arising from your use of this website and agree to release us from any liability in connection with your use of, or reliance upon, the content or products found herein.